These retrospectives are like books written one page at a time, once per year. I do it first to follow Voilà:’s progress, then publish it for all those interested in the evolution of an information design studio.
Human Ressources
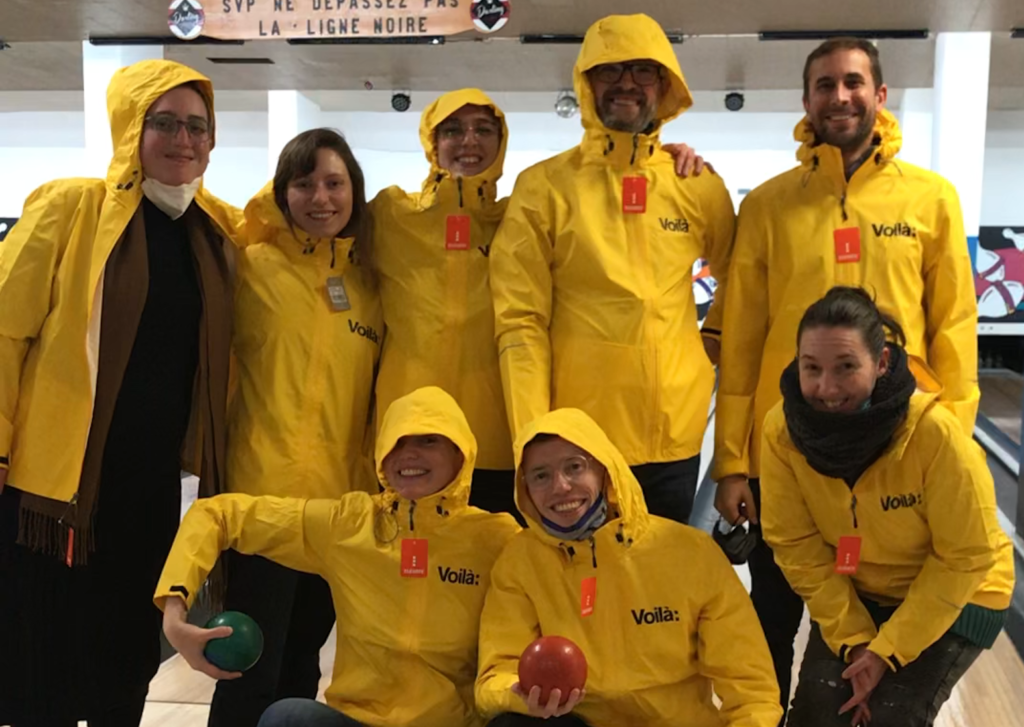
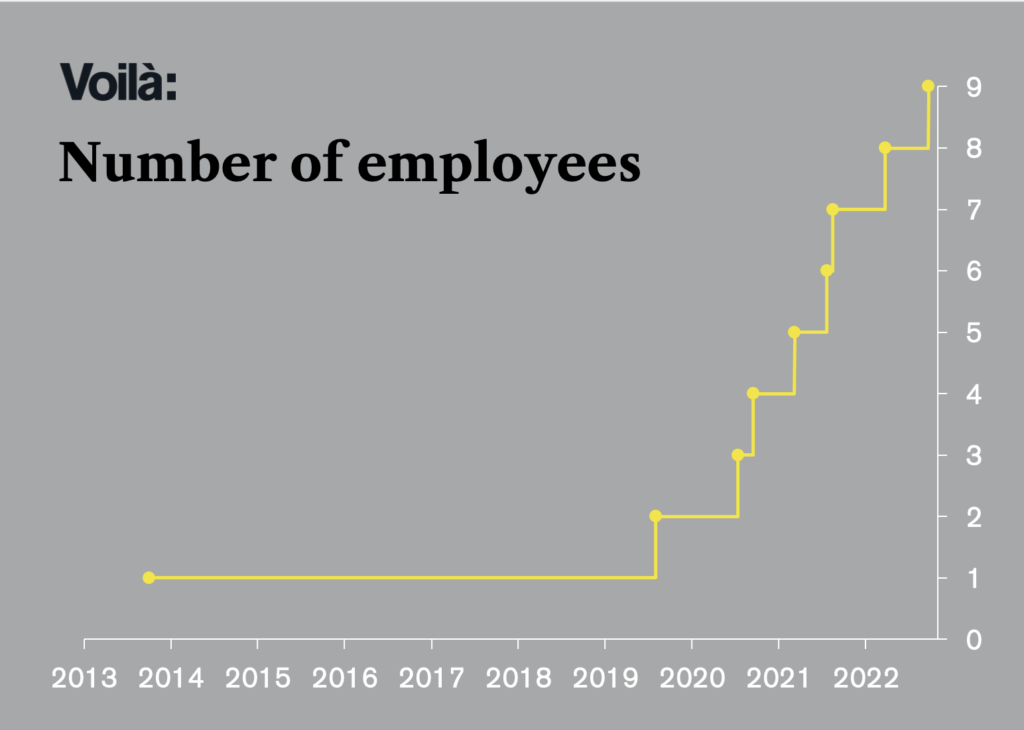
We always start with the most important: the team. It has grown again this year with the addition of two positions and three people.
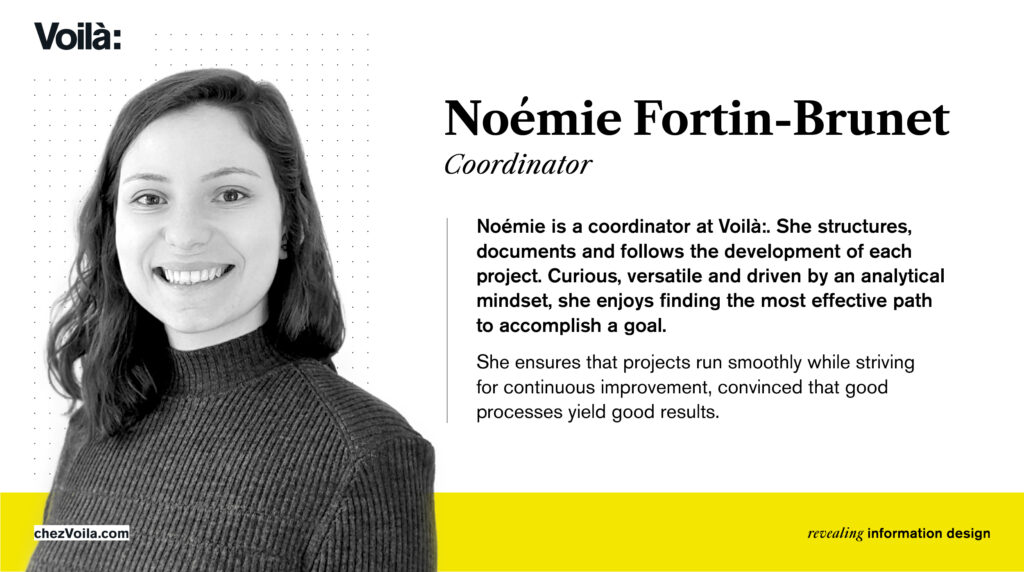
Noémie Fortin-Brunet has become our first coordinator. This new role will help us to stay organized internally and to develop the tools needed to absorb future growth.
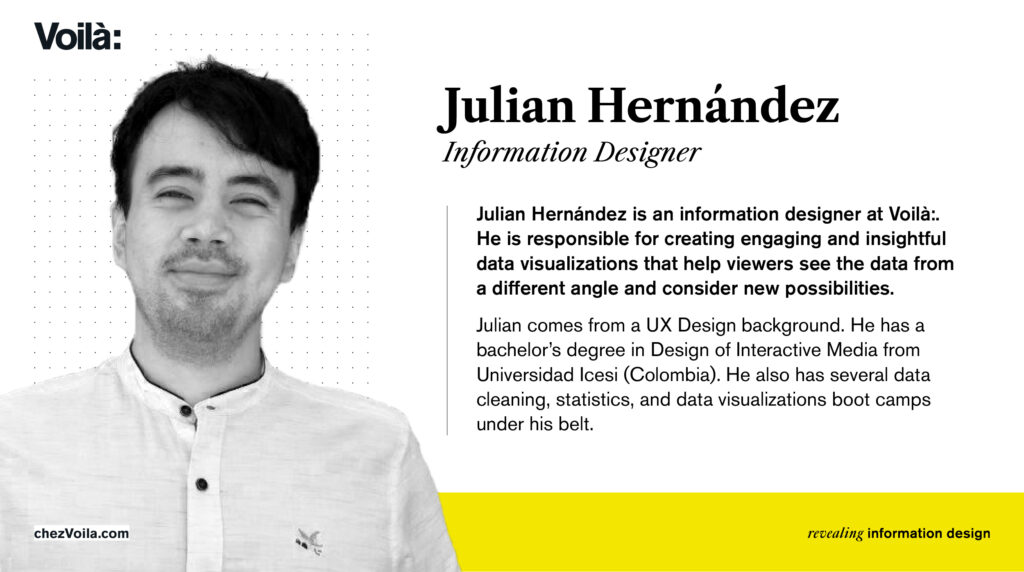
Julian Hernández has become our third information designer. This allows us to meet growing demand, while Timour reduces his workload to undertake a master’s degree.
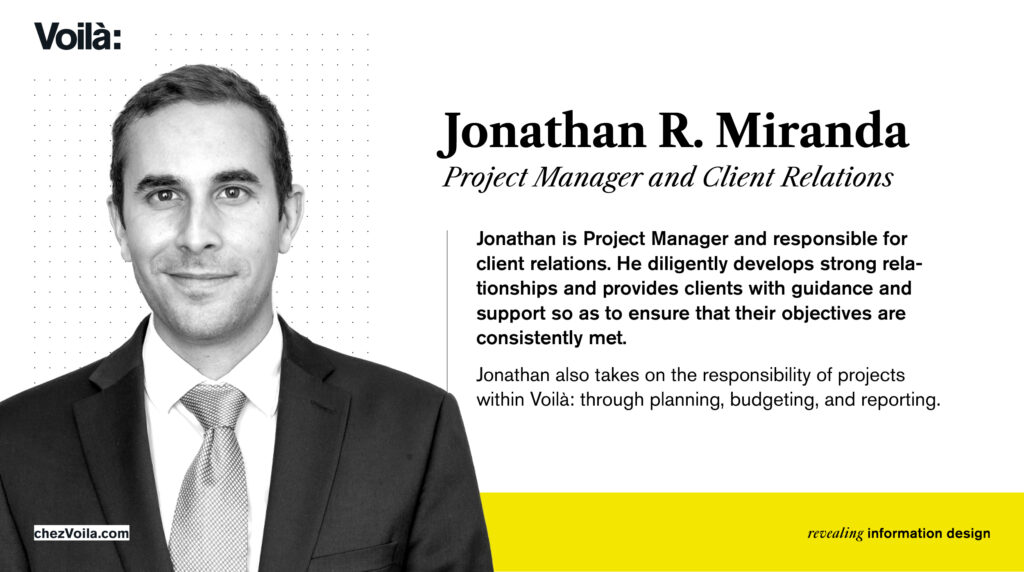
We recruited a third person, Jonathan Miranda, as project and client relations manager, to fill Chloé’s maternity leave. She will return in early 2023.
Additionally, we had the chance to collaborate with two information designers we greatly admire: Jorge Camoes and Joey Cherdarchuk.
Projects
The pace of projects outpaces our capacity to share them all on social media, let alone on our portfolio. But we still managed to add four to our portfolio this year, listed below.

Complex illustrations combined with a boustrophedon spanning 4.5 billion years. Read a few words on this project in this Twitter thread.
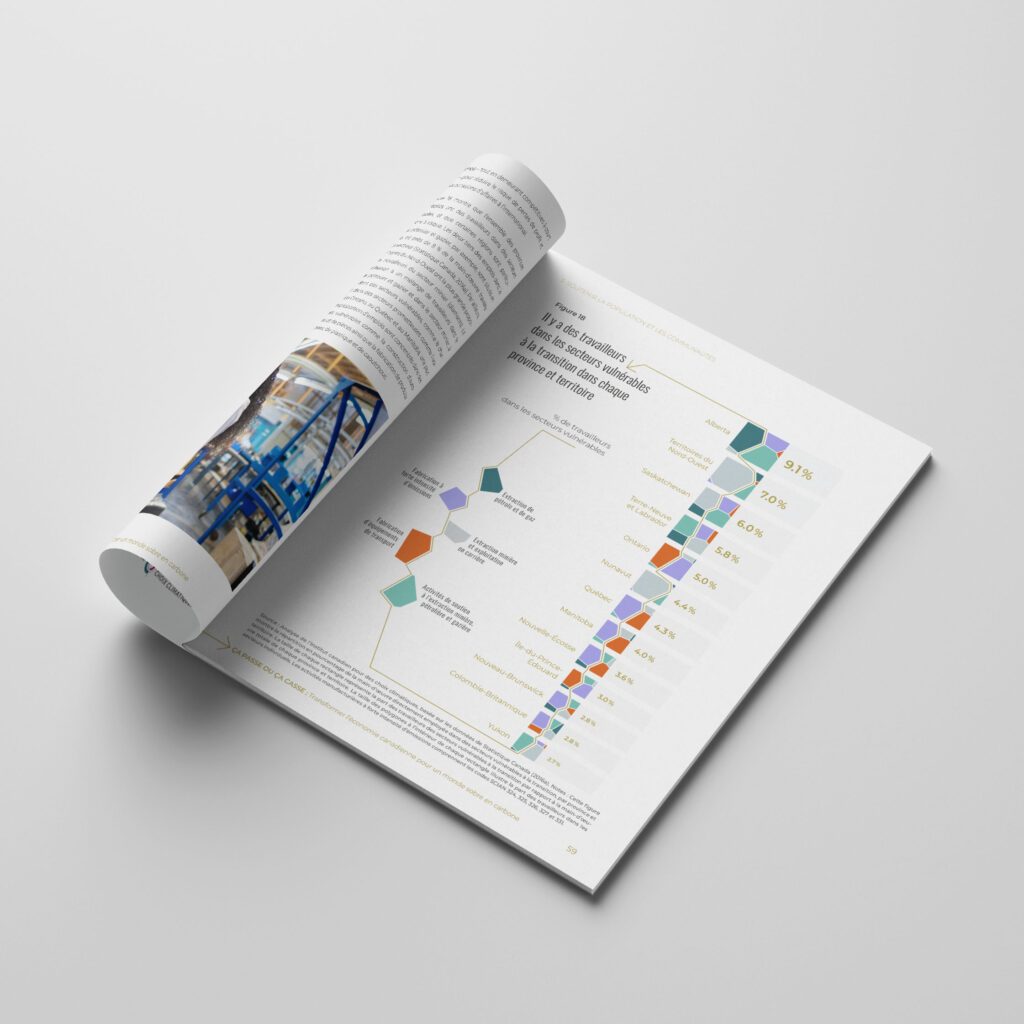
A strong identity for this report, from the cover to the graphics.

A turnkey report with art direction and spectacular network graphics.
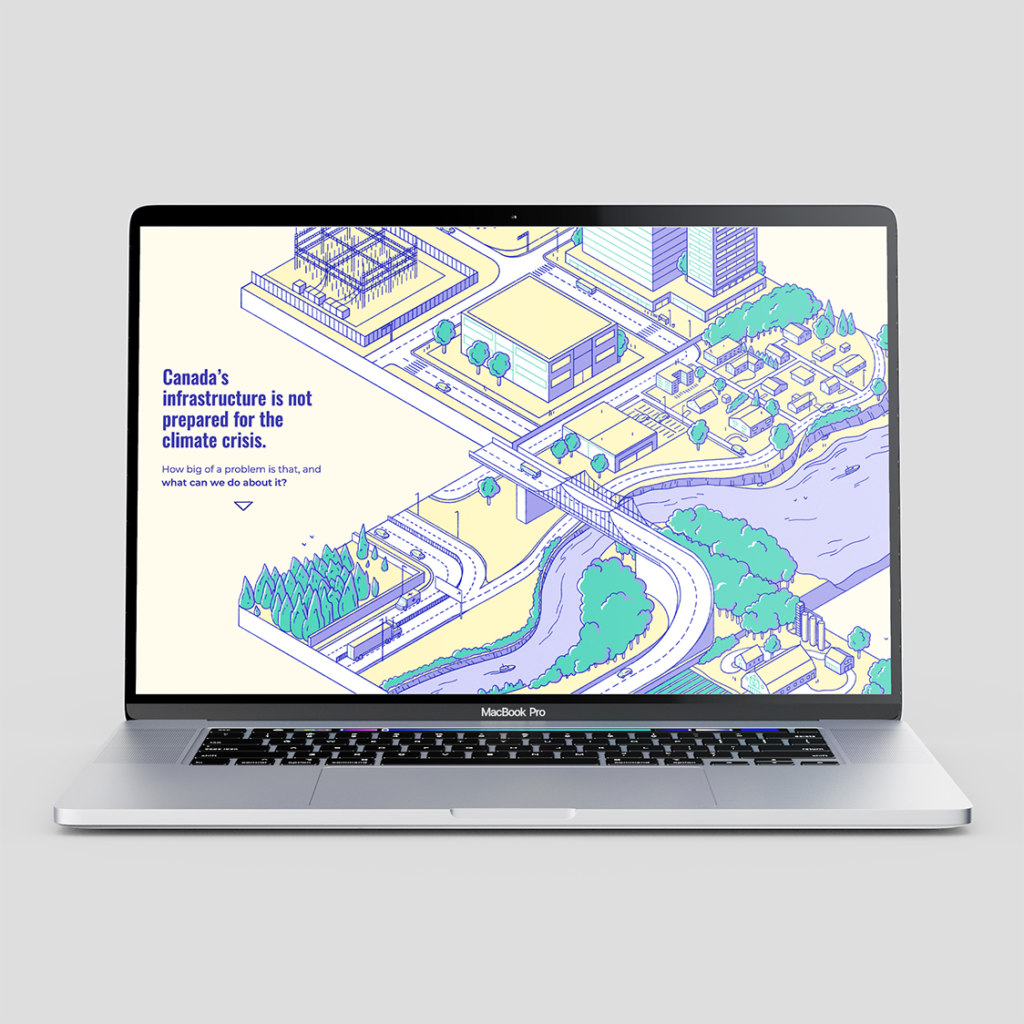
Interactive illustrations in a scrollytelling full of surprises. See the project’s behind the scenes on Twitter.
Our desire to contribute to more ambitious projects has been realized in several ways, including two projects presented at COP27 in Egypt. The first is a dashboard from the Canadian Climate Institute to track Canada’s progress towards carbon neutrality. The second is a World Bank report on cities and climate change.
We also worked on a University of Chicago project that earned a lengthy article in USA Today. And we developed data visualization standards for a website with millions of visitors, but that’s still under wraps for now.
Here’s a roundup of projects that we’ve been talking about on social media but haven’t had the opportunity to present in detail yet:
- The Big Switch: How to Power a Carbon Neutral Canada
- Due North: Addressing the Costs of Climate Change for Northern Infrastructure
- Damage Control: Reducing the Costs of Climate Impacts in Canada
- Women’s Economic Empowerment: Building evidence for better investment
- The Performance of the Seniors’ Care System in Long-Term Care Facilities (in French)
I could go on and on! I would like to note a first this year: a report entirely in HTML, in order to improve accessibility.
Internal projects
It’s hard to find the time for visualization projects that don’t come from a client request, but we managed to create two this year.
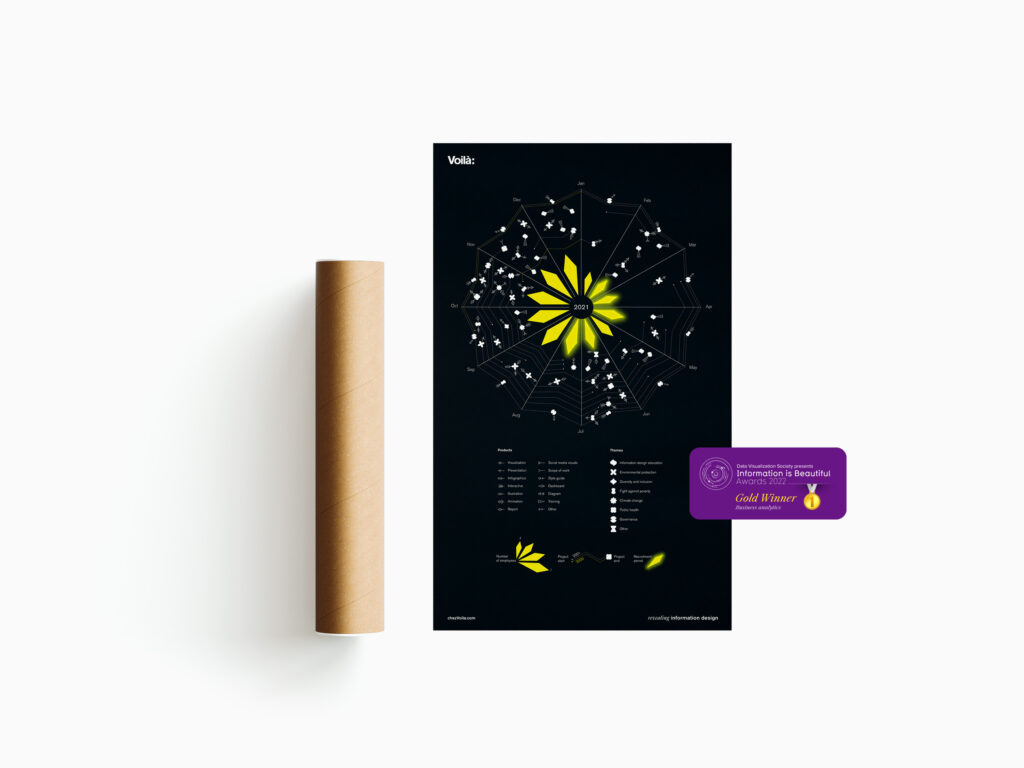
At the beginning of the year, we published our first visual review in the form of a greeting card to friends of Voilà:. It was a great creative and marketing exercise for us. And that is what led us to our win at the Information is Beautiful Awards!
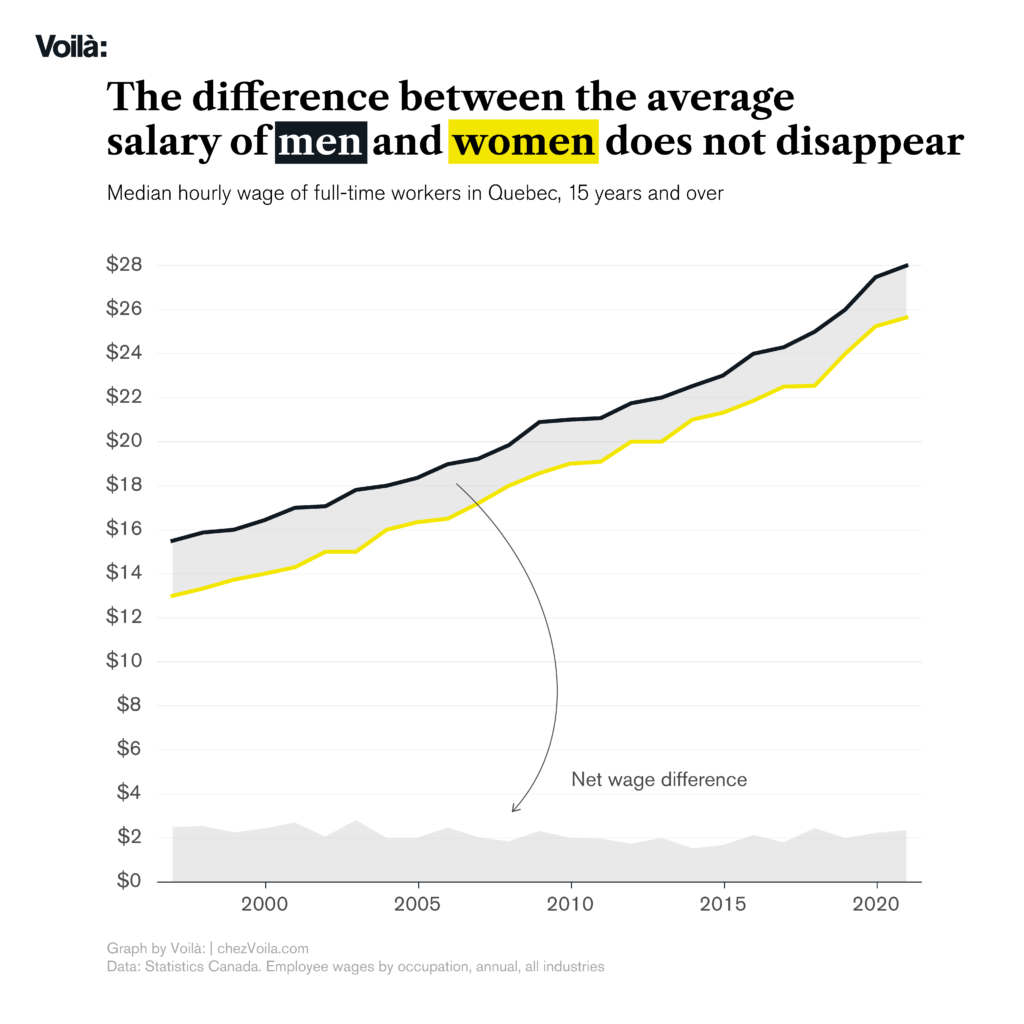
In March, we updated our graphics for International Women’s Rights Day, which were featured in Andy Kirk’s Little of visualization design series.
Recognition and visibility
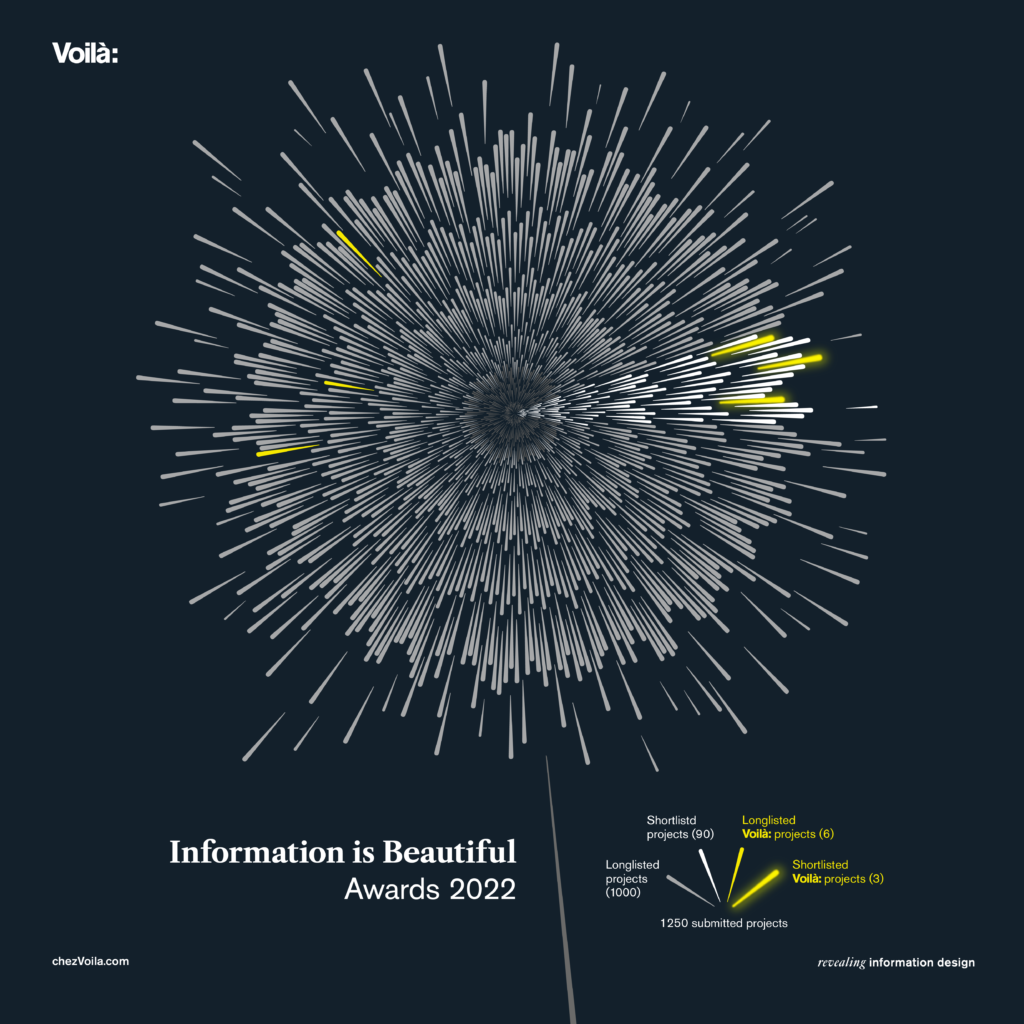
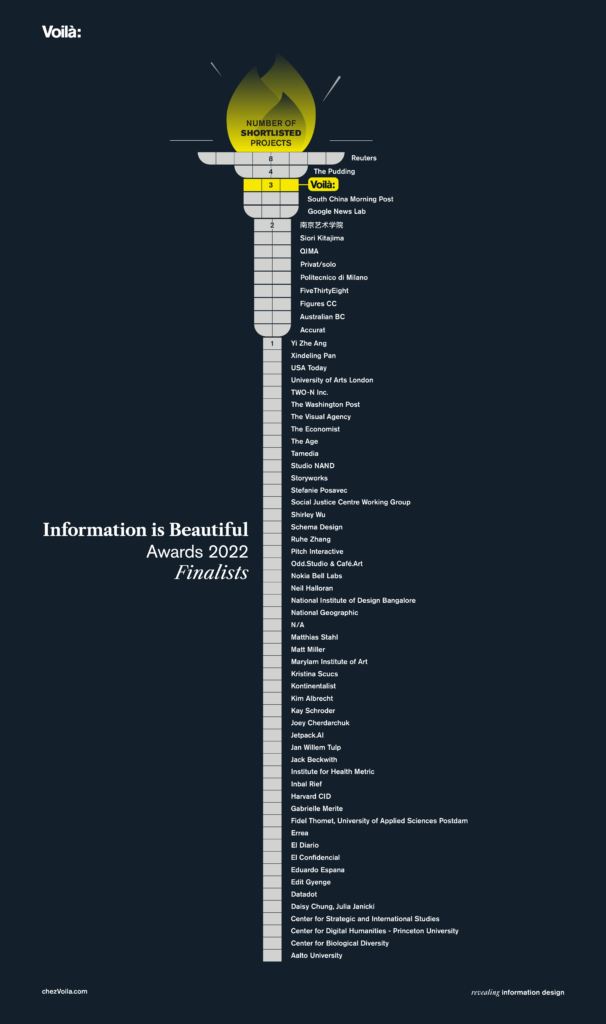
There is no doubt that our gold medal at the Information is Beautiful Awards in November was a highlight of the year. In fact, the whole experience was very positive, as all six of the projects we submitted were selected and three were finalists.
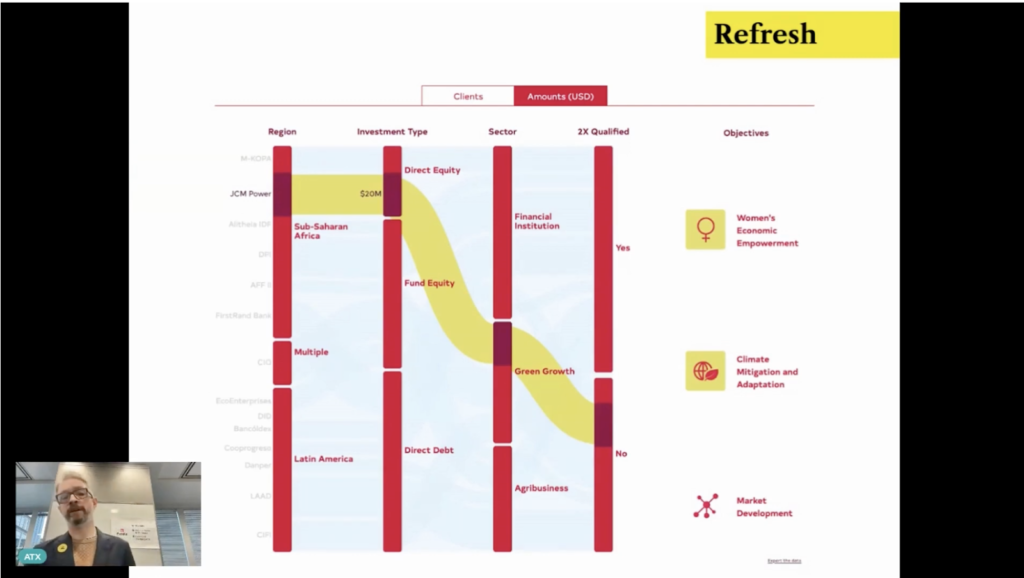
To highlight the calibre of the competition, we included all nominated organizations in our visualizations (below) and published a blog post about the shortlisted projects that inspire us.
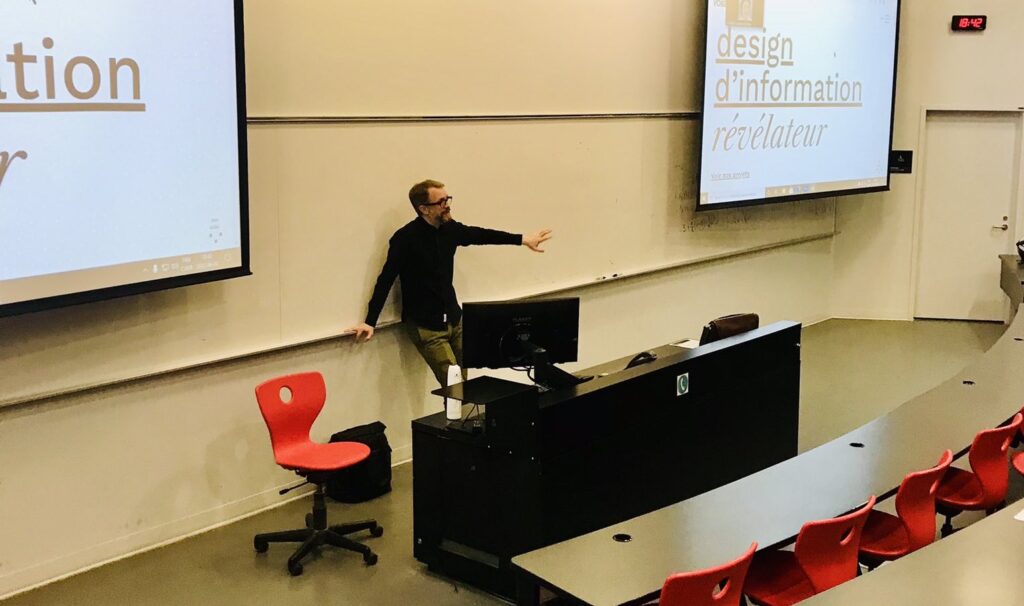
I admit I love public speaking, so the multiple invitations to do so this year have made me very happy. The theme is usually about what happens behind the scenes, be it management or design.
I talked about my experience founding and running an information design studio on Andy Kirk’s Explore Explain podcast
I was also invited to speak to data visualization students at the Maryland Institute College of Arts and Polytechnique in Montreal.
I gave a 10-minute lightning presentation about the creation of one of our finalist projects at the Information is Beautiful Awards, the interactive portfolio for FinDev Canada.
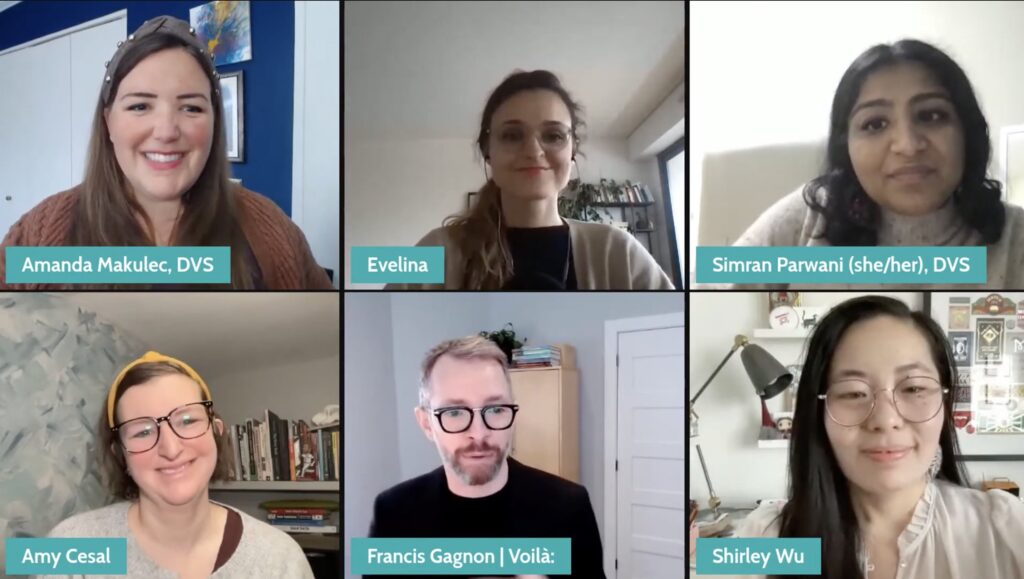
I was also invited by the Data Visualization Society to participate in the post-ceremony conversation between organizers and winners about the return and future of these awards.
In Quebec, Benoît Giguère interviewed me for his column on data visualization in Le Soleil and Jean-François Venne included me in his article on data visualization for the HEC’s Revue Gestion.
Timour and I have given a dozen trainings, for organizations such as McGill School of Continuing Education, the Factry and to many direct clients. I expect to increase the visibility of this service offering in 2023.
Social Media
Our social media audience has also seen excellent growth, even doubling in some cases like Instagram and LinkedIn. It’s a great reflection of our commitment to getting our work out there and offering original content on these platforms. In 2023, I’d like to make sure more of that content makes its way to our own blog.
We published eight blog posts, including this one. We were also surprised to learn that Patricia’s post (in 2021) on the Do No Harm Guide inspired the next edition (2022) of the guide, bringing additional perspectives.
We also revived our presence on Mastodon, reflecting the risks of the Twitter platform since its acquisition.
We published seven newsletters, including two special editions on the Information is Beautiful Awards. It is always a challenge to keep a regular publication schedule. Fortunately, our audience is loyal, with an open rate of above 50% and good growth, with very few unsubscribes.
In-House Management
On the management side, I have decided to invest more in my role as a manager and entrepreneur. I have a new business mentor and I now receive support from PME MTL in the form of meetings and advice. I also participated in my first entrepreneurial event.
In February, we did our first strategic planning. The whole thing was organized fairly quickly and the internal consultation, done remotely, only lasted half a day, but the results were very useful, allowing us to continue with monthly follow-ups. We will repeat the experience.
After being implemented in 2021, Voilà:’s group insurance will have been enhanced with the addition of dental, vision, and more health care coverage.
We have a strategic planning session scheduled for the middle of January, when Patricia will be in Montreal. This will also be our first opportunity to see her in person, as she has been working from Vancouver since her arrival at Voilà:!
Will there be another addition to the team in 2023? For the first time, I can’t say for sure. The continued increase in demand suggests so, but we also have some optimization work to do internally. One of those tasks involves making myself more responsive to team needs, which often await my input or approval.
One thing is certain, 2022 will have provided a great momentum that bodes well for 2023.
Francis Gagnon is an information designer and the founder of Voilà: (2013), a data visualization agency specialized in sustainable development.
