Voilà: has received three awards at the 2026 IIID Award, presented by the International Institute for Information Design at the designforum Vienna during the VisionPlus conference. The firm received a Distinction, the highest recognition…
Voilà: has received three awards at the 2026 IIID Award, presented by the International Institute for Information Design at the designforum Vienna during the…
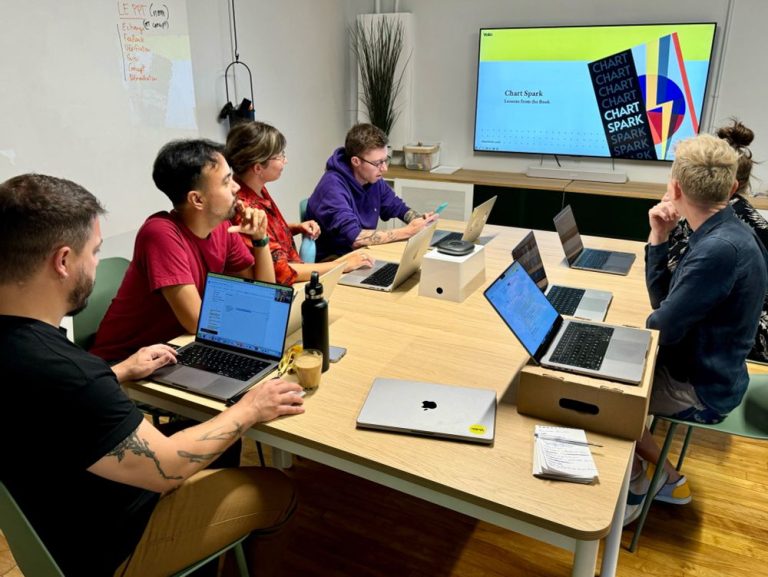
Celebrating Voilà:’s 11th anniversary this month, we took a moment to reflect on what defines us. That’s why we chose to celebrate multidisciplinary as…