Chart Spark is an amazing book by Alli Torban centered around creativity and innovation with tips on how to harness them. It is focused on data communication and visualization but would be a great read for anyone interested in creativity.

Alli Torban is an influential figure in the data viz community. She founded the Elevate Dataviz Learning Community, is the host of one the biggest podcast in the industry “Data Viz Today” in which she interviews other data viz practitioners on their process, ideas or tips.
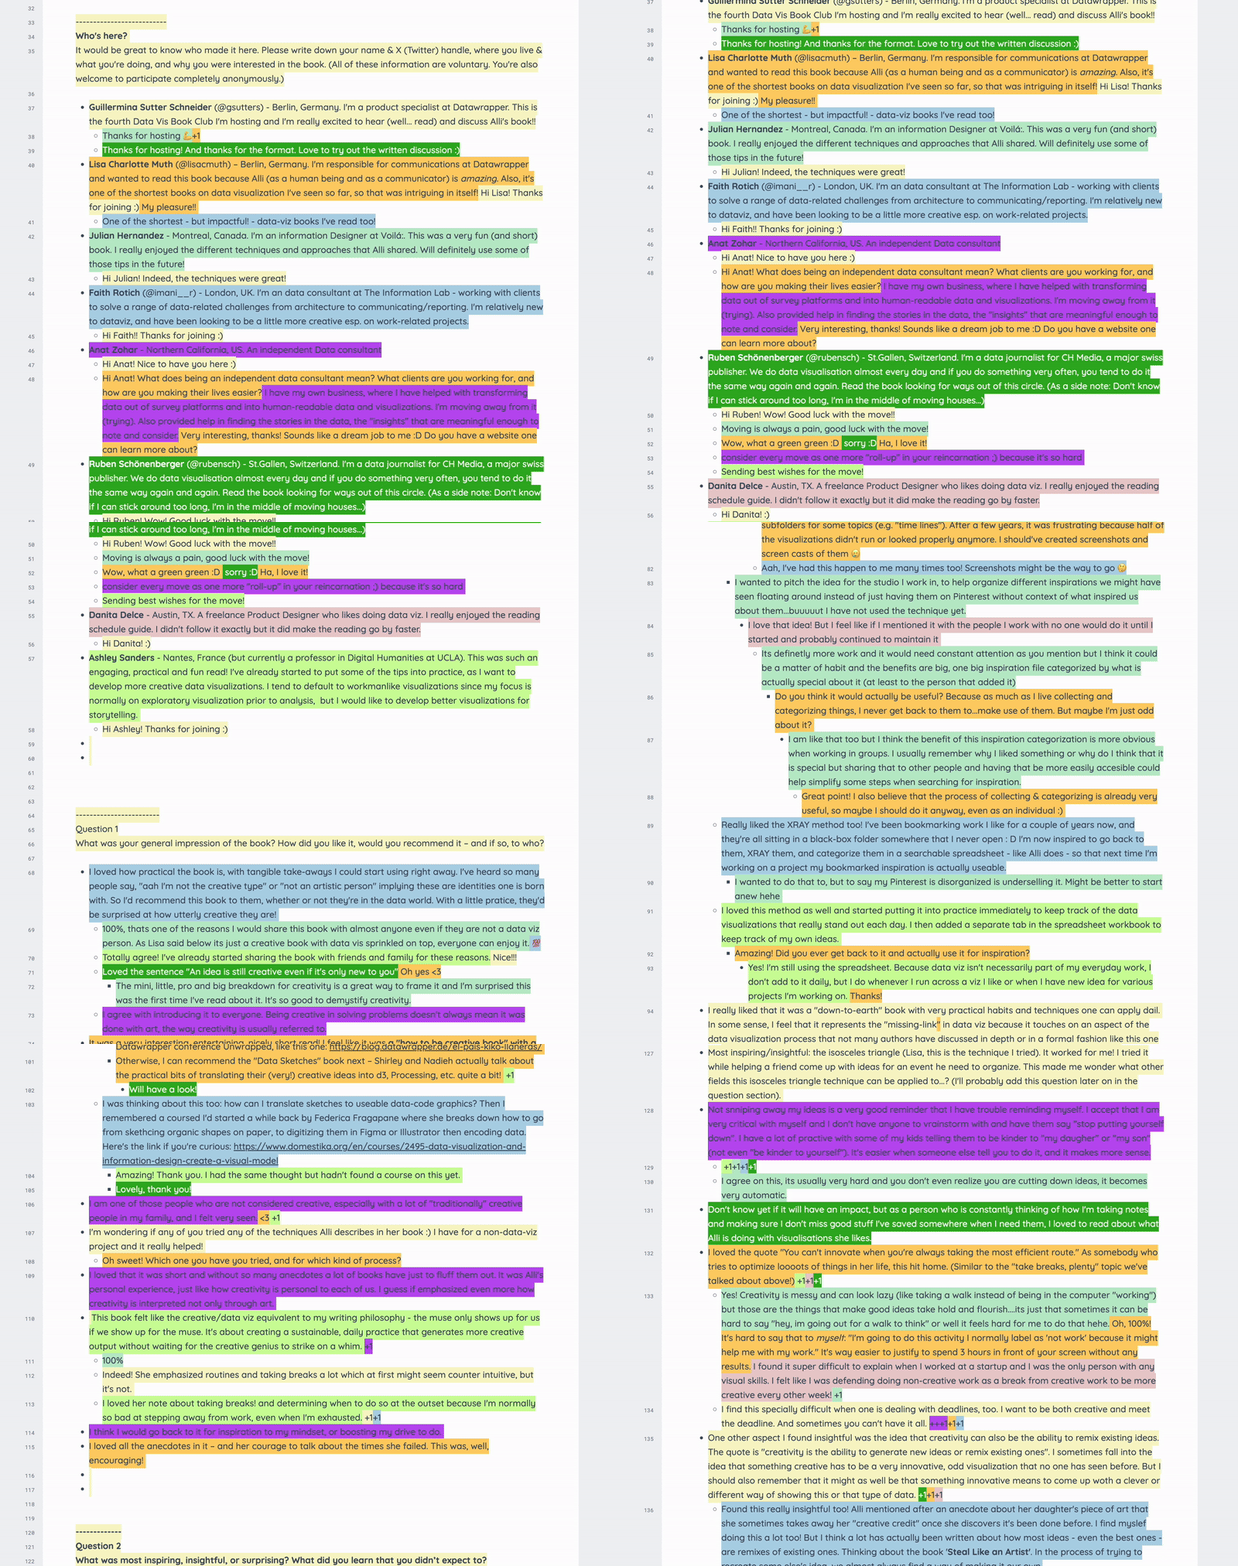
I got the chance to read it in the most recent Data Vis Book Club hosted by Datawrapper. After some interesting discussions, Alli herself jumped in to answer some questions.
With that said…
Things we liked 👇
Its conciseness
This is one of the most concise books I’ve read. It is extremely precise and doesn’t overextend when explaining about a topic. When asked about it on Datawrapper’s Data Vis Book Club she said:
“It is interesting how you don’t really need THAT much to make a point, right? One story, one image, one prompt, one example – done!”
This mindful approach to how points are being constructed into a larger argument makes the book a very easy read.
The book also has several reader-friendly features weaved through it, like breakdown of the topics in each section and a summary at the end of each chapter.
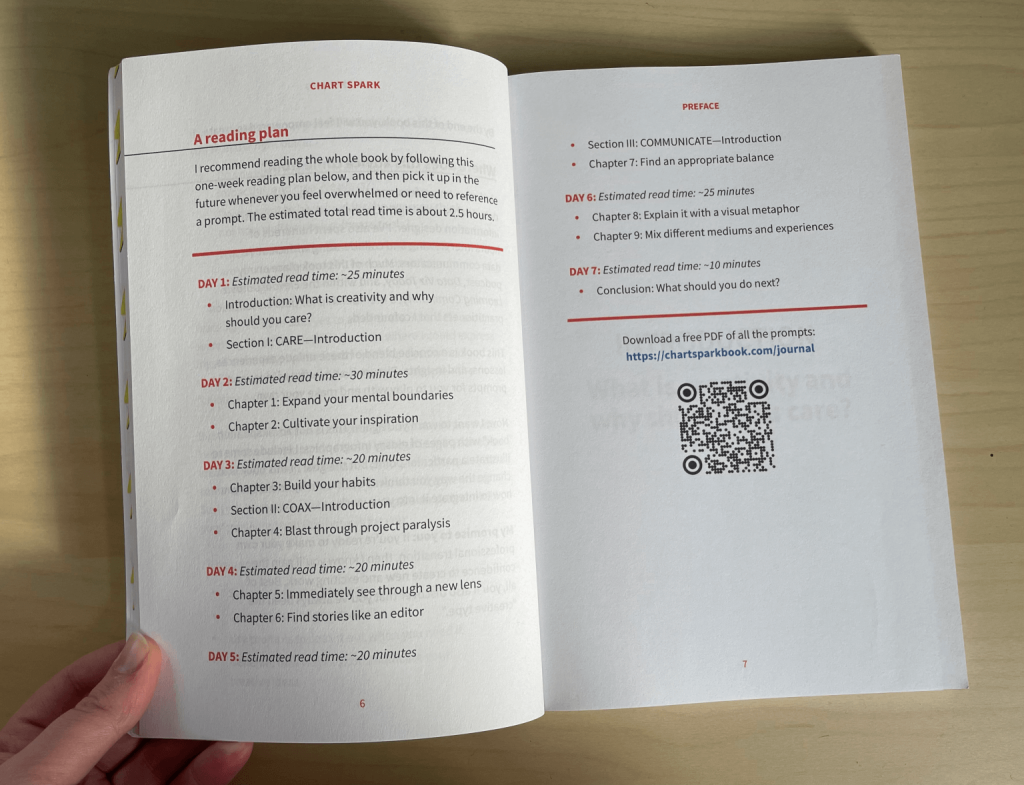
Alli also includes something I personally haven’t seen before, a recommended breakdown of how you should go through the book with “expected reading time” included. This helped me set my reading goals while going through this book.
Her approach to creativity
Lots of books or media look at creativity as almost a “divine” act, in which someone thinks of something no one had ever thought of before and changes everything.
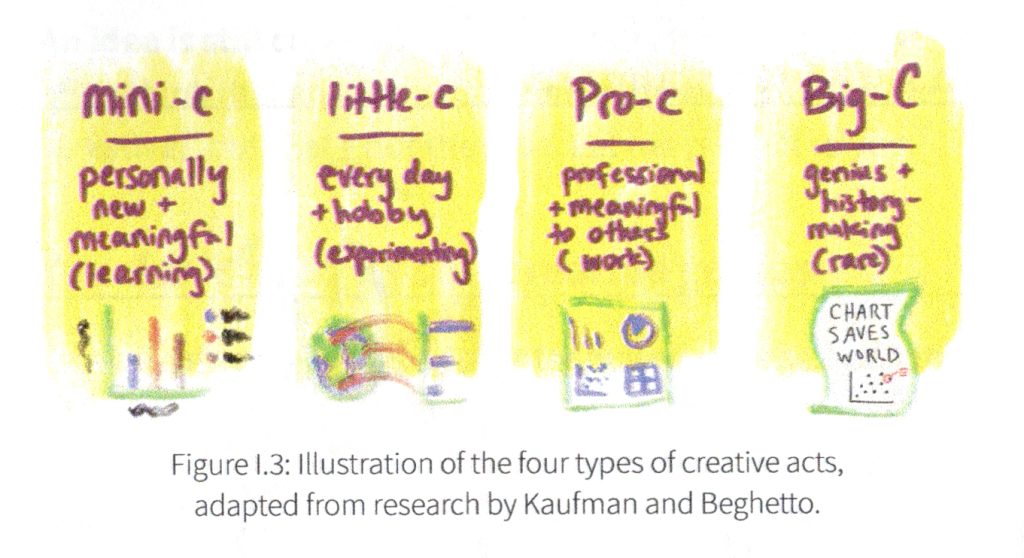
This book brings a more realistic approach with its breakdown of Creativity into 4 categories:
- mini-C: doing something new to you personally;
- little-C: doing something that builds upon things you’ve learned;
- pro-C: doing something new and valuable at a professional level;
- big-C: doing something that has a long-lasting contribution to society.
This frames creativity as something we all can explore every day, not just as a stroke of genius.
The other element the book highlights is the tug-of-war between creativity and efficiency. Efficiency demands the fastest possible solution to a problem. Creativity, on the other hand, needs time to settle, think and marinate. This is an important consideration when you are running a creative business.
Things we would like to try at Voilà: to…
Find inspiration
As a dataviz agency, we are always searching for new sources of inspiration that could help us improve our work. There are several prompts that help harness inspiration in this book, our favorite was:
XRAY Method
This method centers around the importance of classifying and understanding what inspires us, it asks why a certain piece or chart inspires you so that you document those feelings following the XRAY Method, asking yourself the following questions:
- EXCITED: What makes you excited about the work?
- RULES: How well does it follow rules or best practices?
- ANARCHY: How did they throw out the rules?
- YOU: How might you use it in your own work? In which conditions would this be useful?
Alli collects her responses to these questions on spreadsheets which helps her find inspiration that is relevant to the project at hand more easily.
Nurture our creativity
Alli presents several ideas and prompts that get the creative juices flowing. We liked several of them and are looking forward to applying them next time we need an extra boost. Our favorites are:
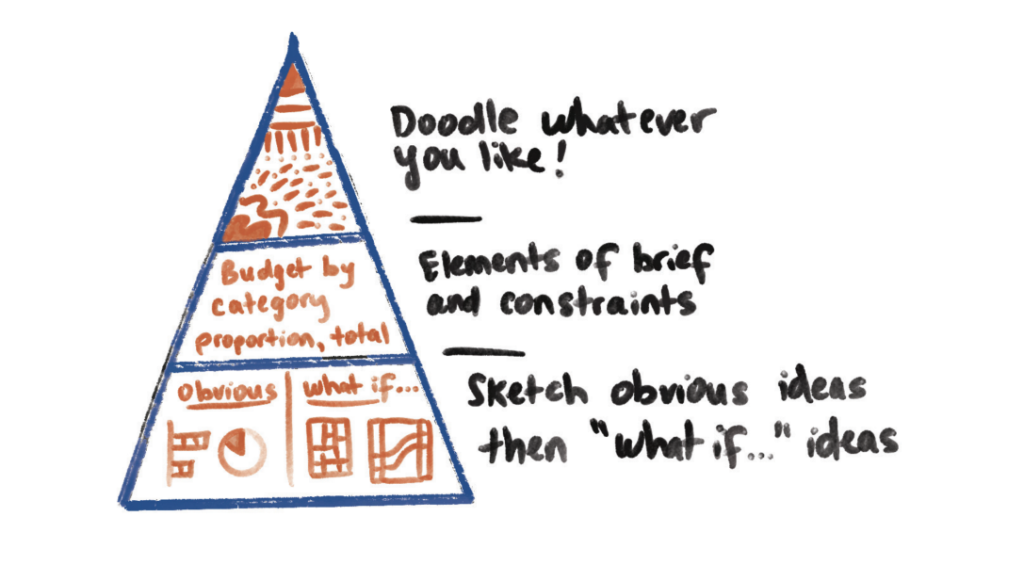
The Idea Isosceles method
This method works to create ideas quickly at the start of a project.
We liked this prompt because it helps you keep your doodling and free-flow mind active (top section) while also focusing you on expanding ideas for the project (bottom section) in an organized manner.
Break-the-box method
This method helps you break out of comfortable patterns by looking at solutions beyond the “obvious”. There have been a couple of projects in which this prompt could have helped us arrive at results quicker.
It consists of drawing a box with an idea or concept inside, then you write the assumptions that come up regarding that concept surrounding it followed by their opposites.
This process should be done in less than 2 minutes and give you a quick idea of the some assumptions you could challenge in your project.
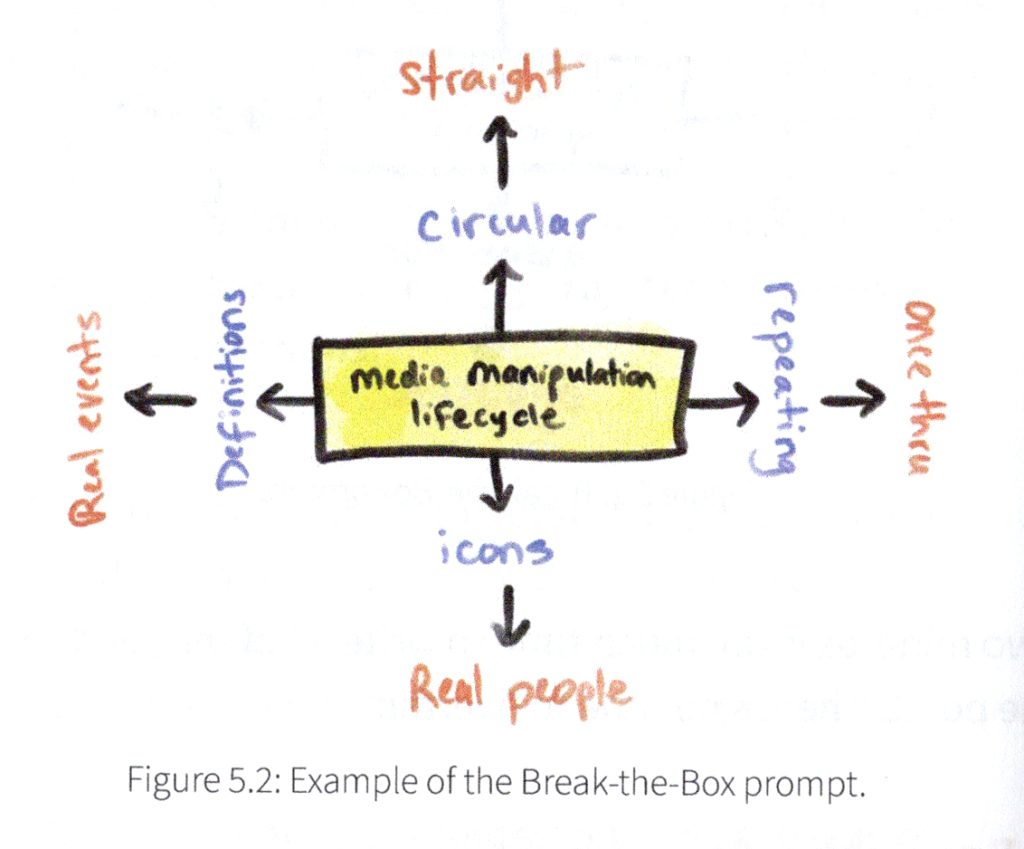
Chart Spark is a fabulous book that you can read in a quiet afternoon. If you want to improve your approach to creativity give it a look!

Julian Hernández is an information designer at Voilà:. He is responsible for creating engaging and insightful data visualizations that help viewers see the data from a different angle and consider new possibilities.
