Voilà: has received three awards at the 2026 IIID Award, presented by the International Institute for Information Design at the designforum Vienna during the VisionPlus conference. The firm received a Distinction, the highest recognition…
One of our objectives at Voilà: is to promote information design, especially in Montreal. When data viz Prof Thomas Hurtut from Polytechnique Montréal offered…
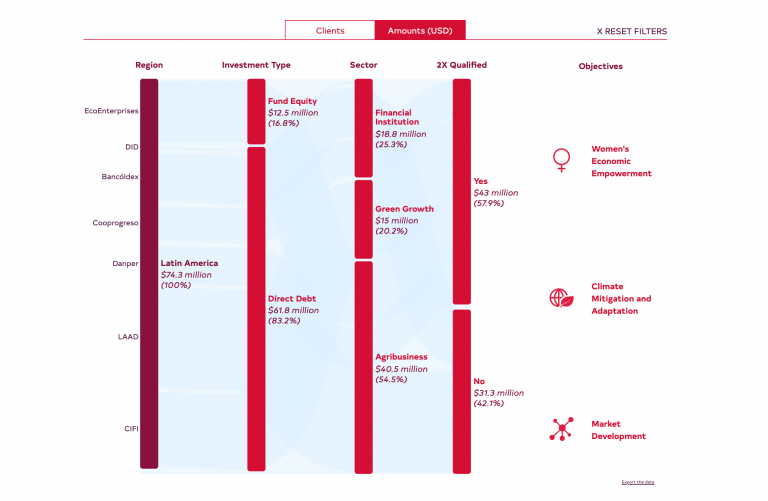
For International Women’s Day 2020, we published a series of seven charts (Facebook, Twitter, LinkedIn, Instagram) on social media that illustrate the situation of women, especially…
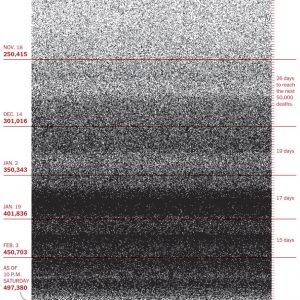
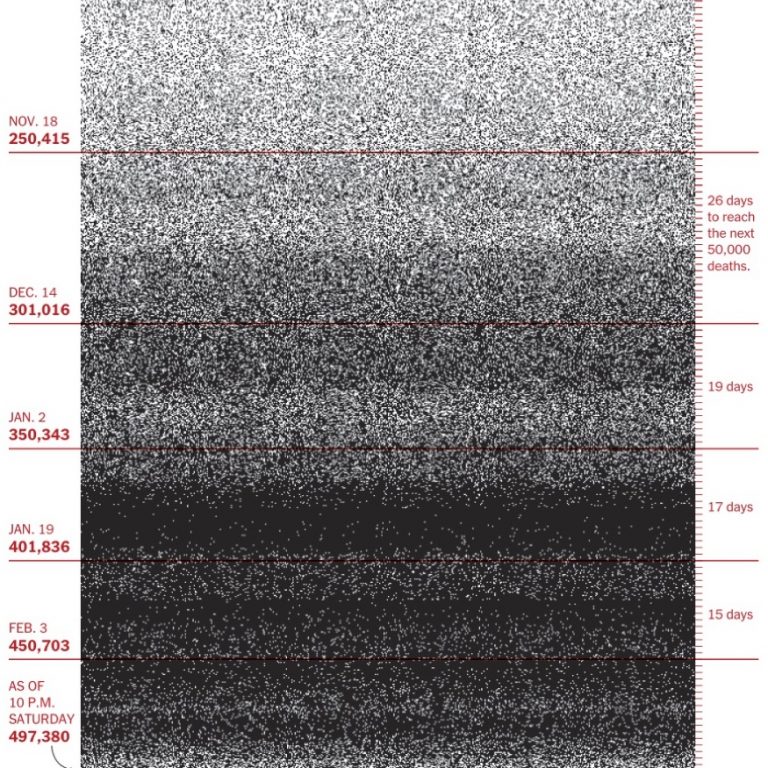
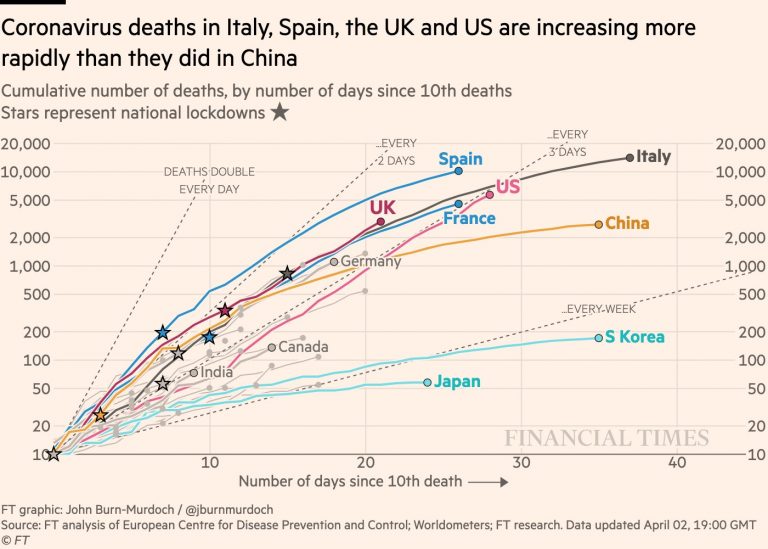
Voilà: has not yet published a single chart about the COVID-19 pandemic yet, despite being specialized in data visualization. This is because the subject…