The Canadian economy and the transition to a low-carbon world
This report by the Canadian Institute for Climate Choices presents the opportunities for the Canadian economy to actively participate in building a low-carbon world. We supported them in presenting their findings and recommendations with clear and attractive visuals, developing the artistic direction, the concepts and even animated versions of the graphs.
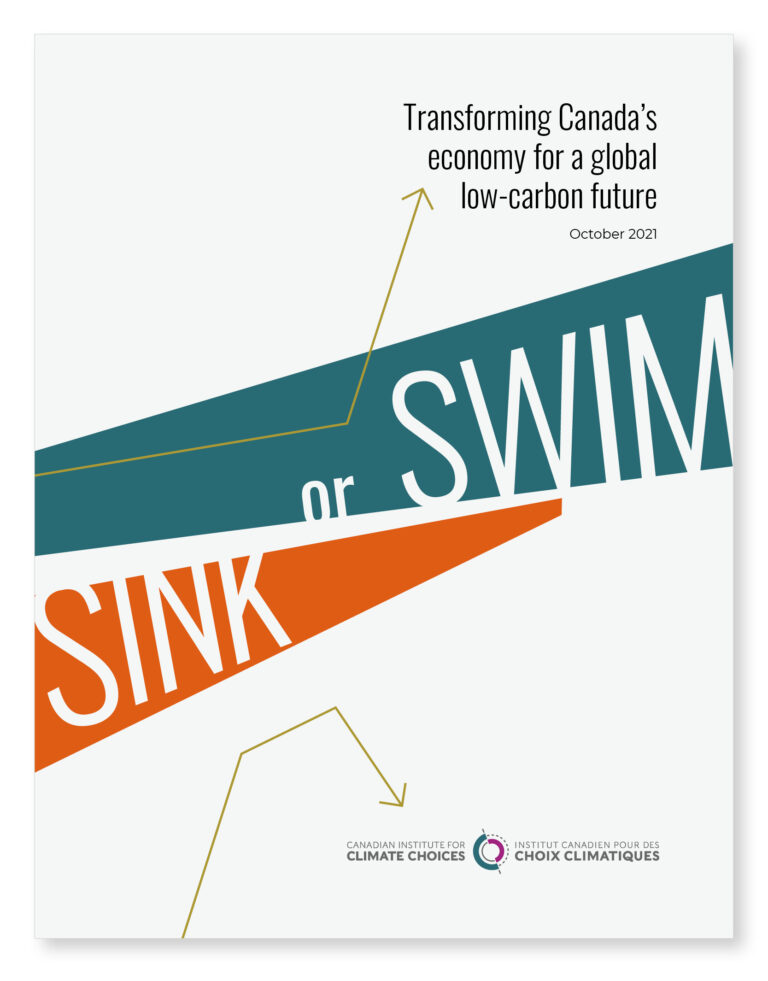
Cover page and concept
The graphic elements of the cover page reinforce the report title to create a strong and demonstrative visual impact. We highlight both the dilemma facing the Canadian economy and the opportunities that come with a transition to a low-carbon world.
The oblique positioning of shapes and text communicates the urgency created by the global transition.
Impactful graphics, highlighting the meaning of the subject
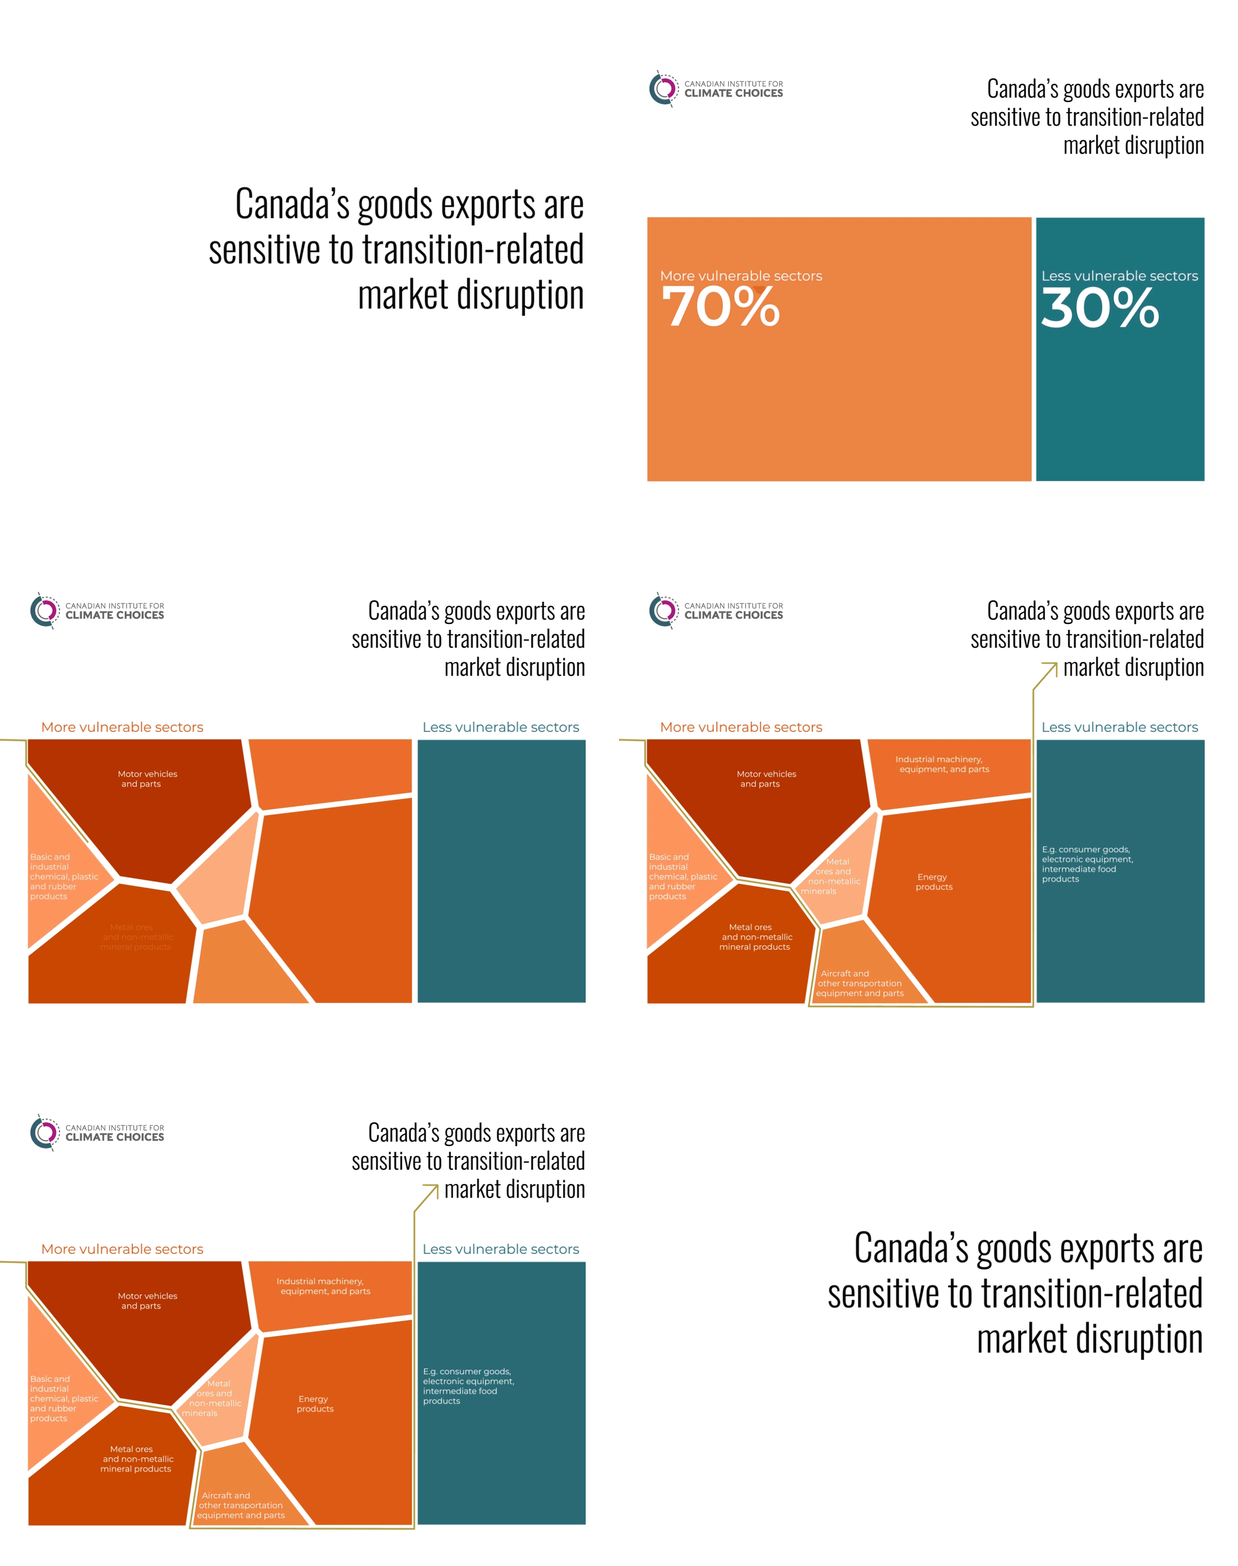
This report highlights the key sectors of the Canadian economy capable of moving the country towards clean growth. We have illustrated them using irregular shapes, often massive like the sectors that they represent.
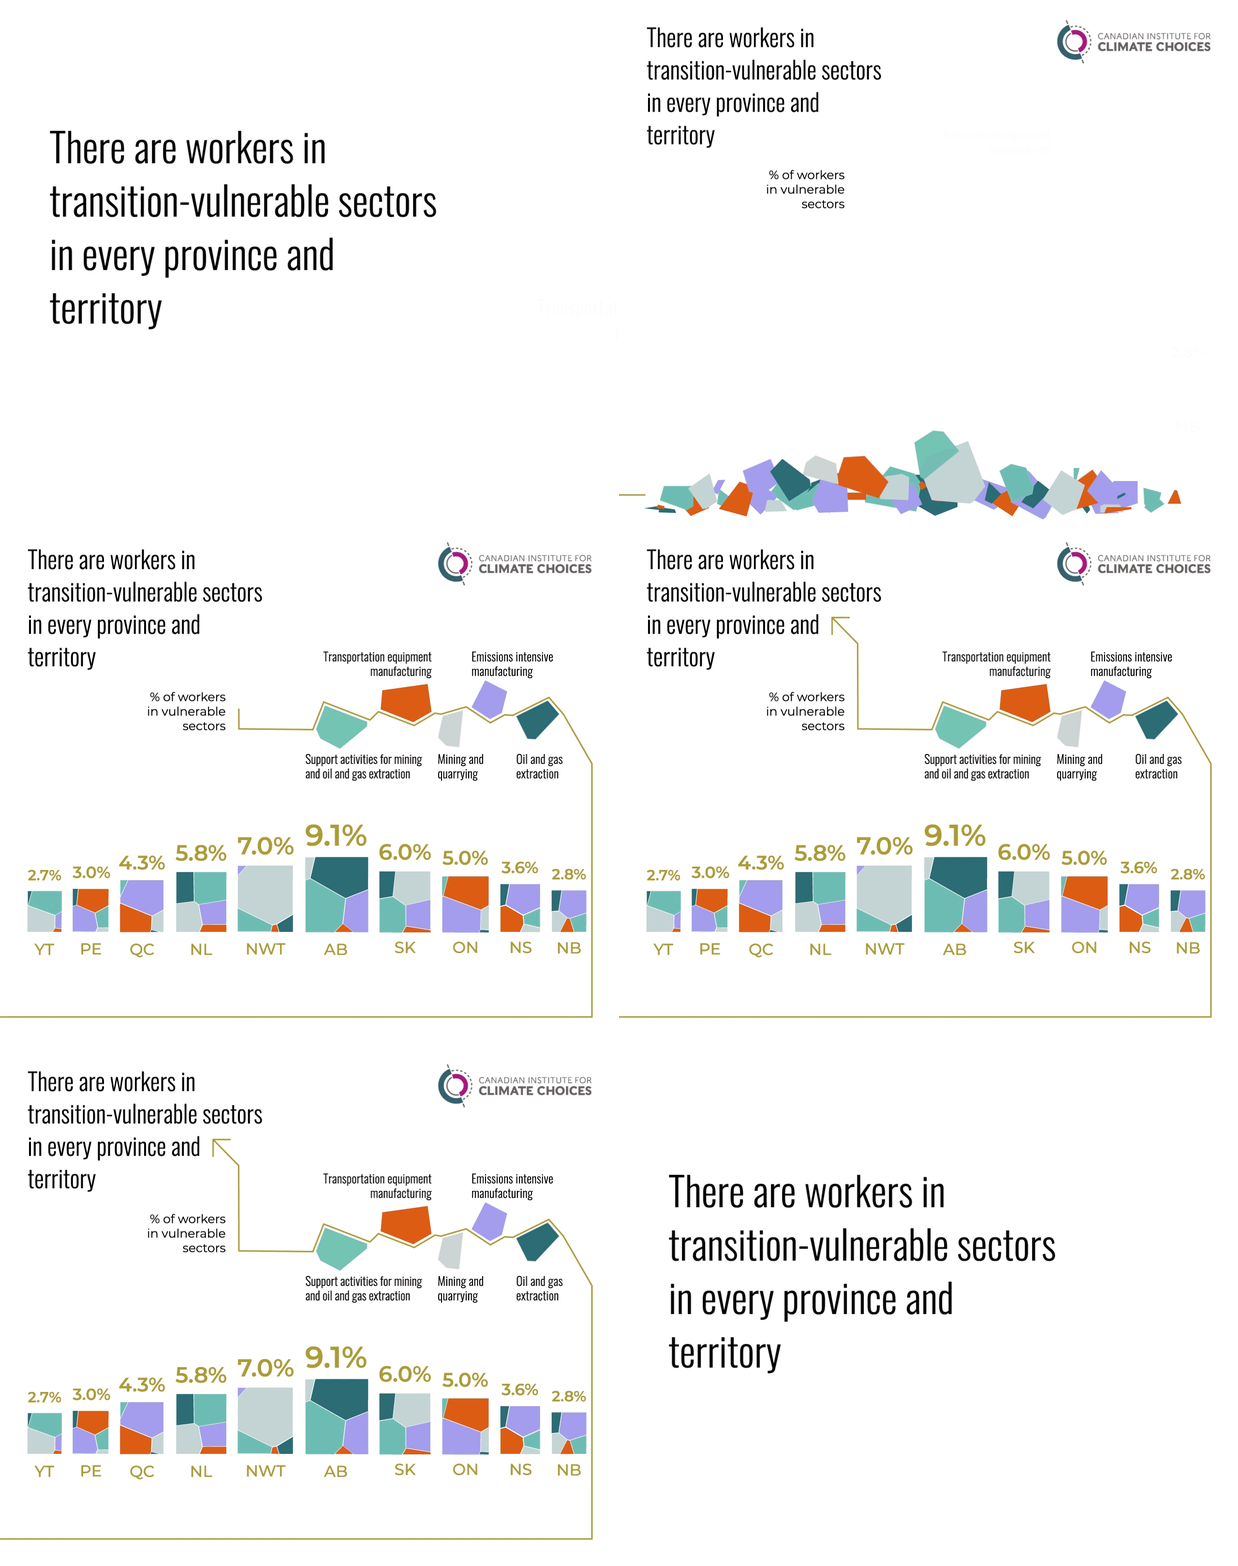
In the example below, these shapes come together to represent which sectors are vulnerable to the major trends that are transforming world markets. Vulnerable sectors are now grouped under the same colour to immediately differentiate them from sectors that are not.
Urgent choices for affected sectors
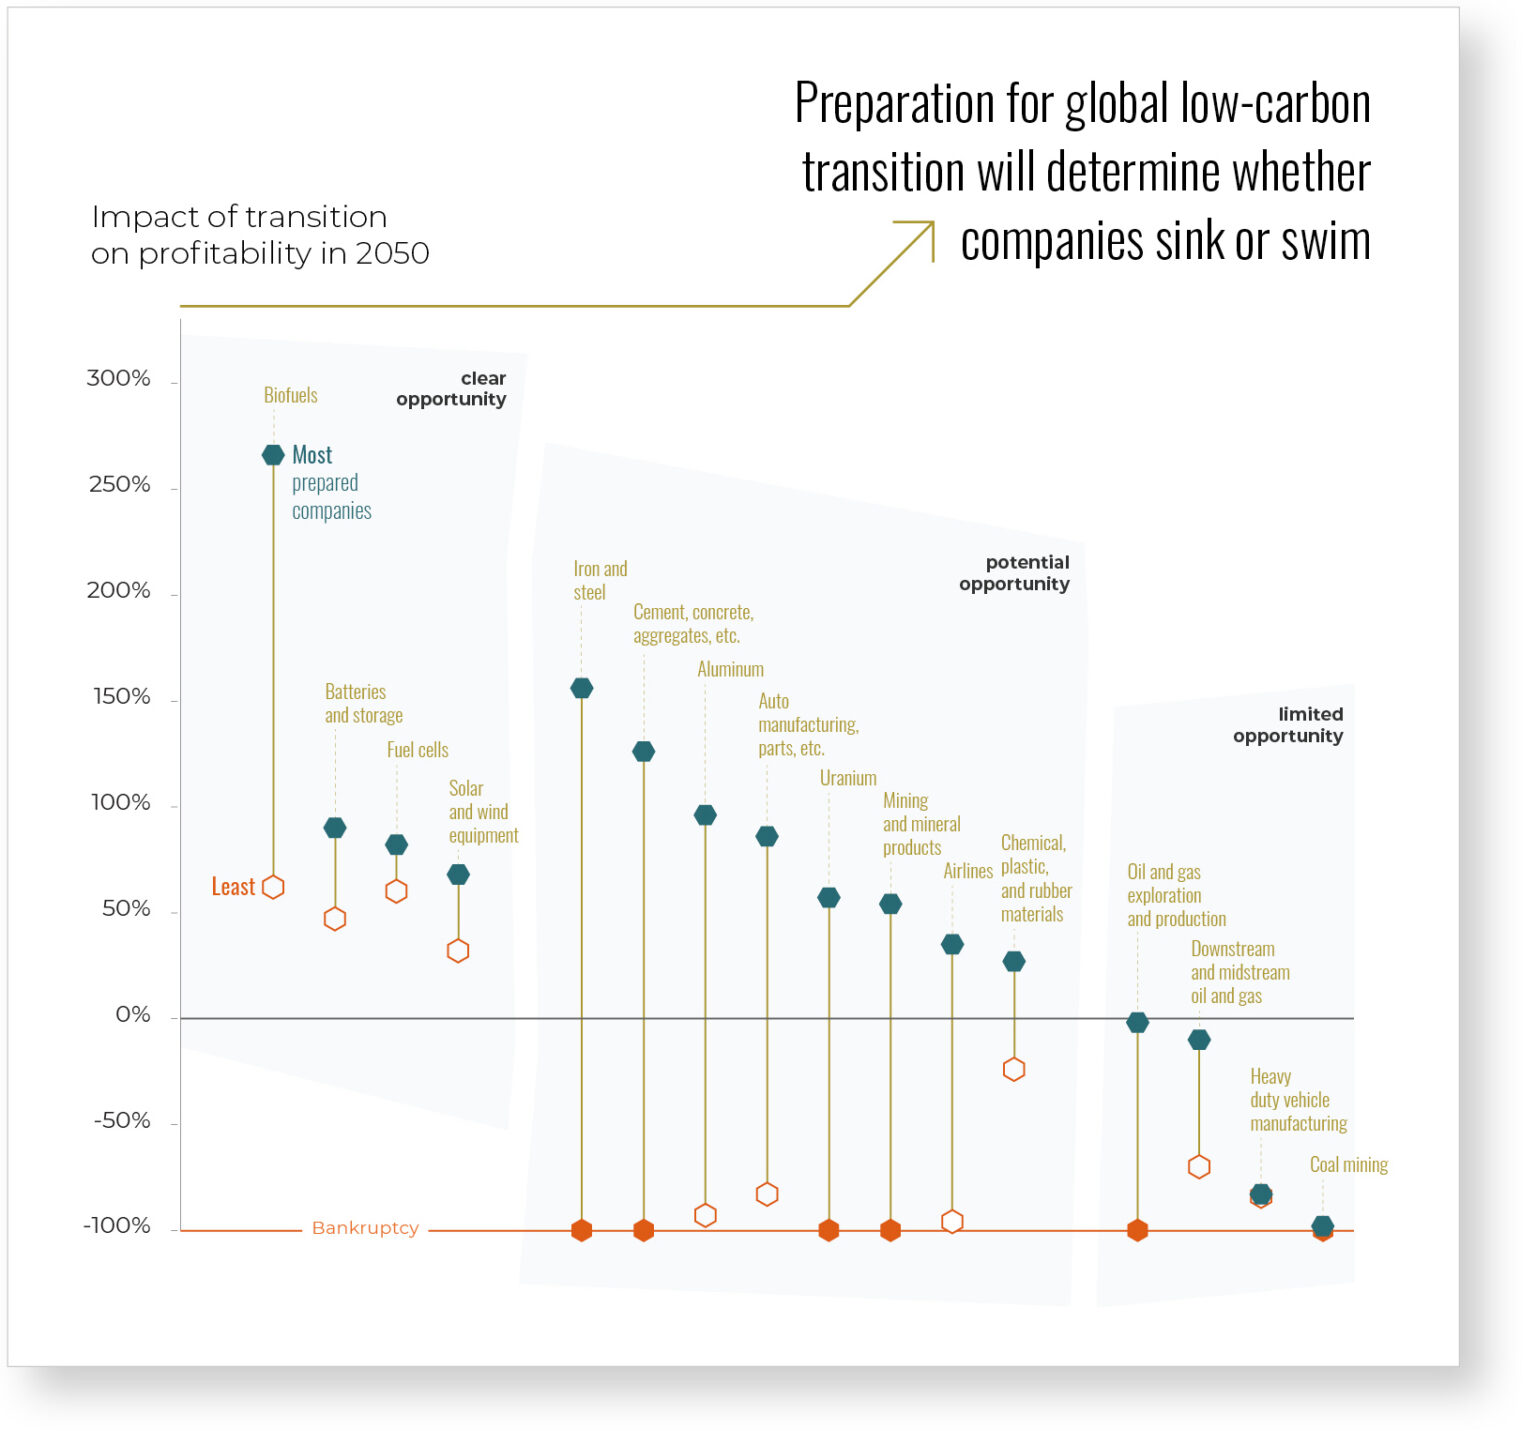
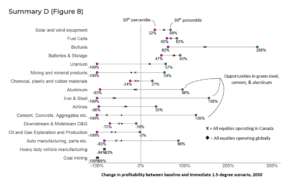
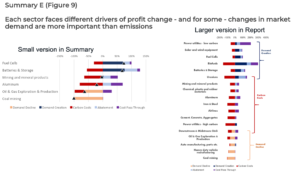
This graphic seeks to demonstrate that international action to reduce climate change will impact each sector differently, and within each of them, companies will have to make choices. By adapting, they may see a positive impact on profitability and thrive. Otherwise, they may sink to the bottom and risk bankruptcy.
Massive and multi-channel dissemination of information
In order to reach a larger audience, we have been commissioned by the Institute to develop both static and animated versions of the key data of the report.
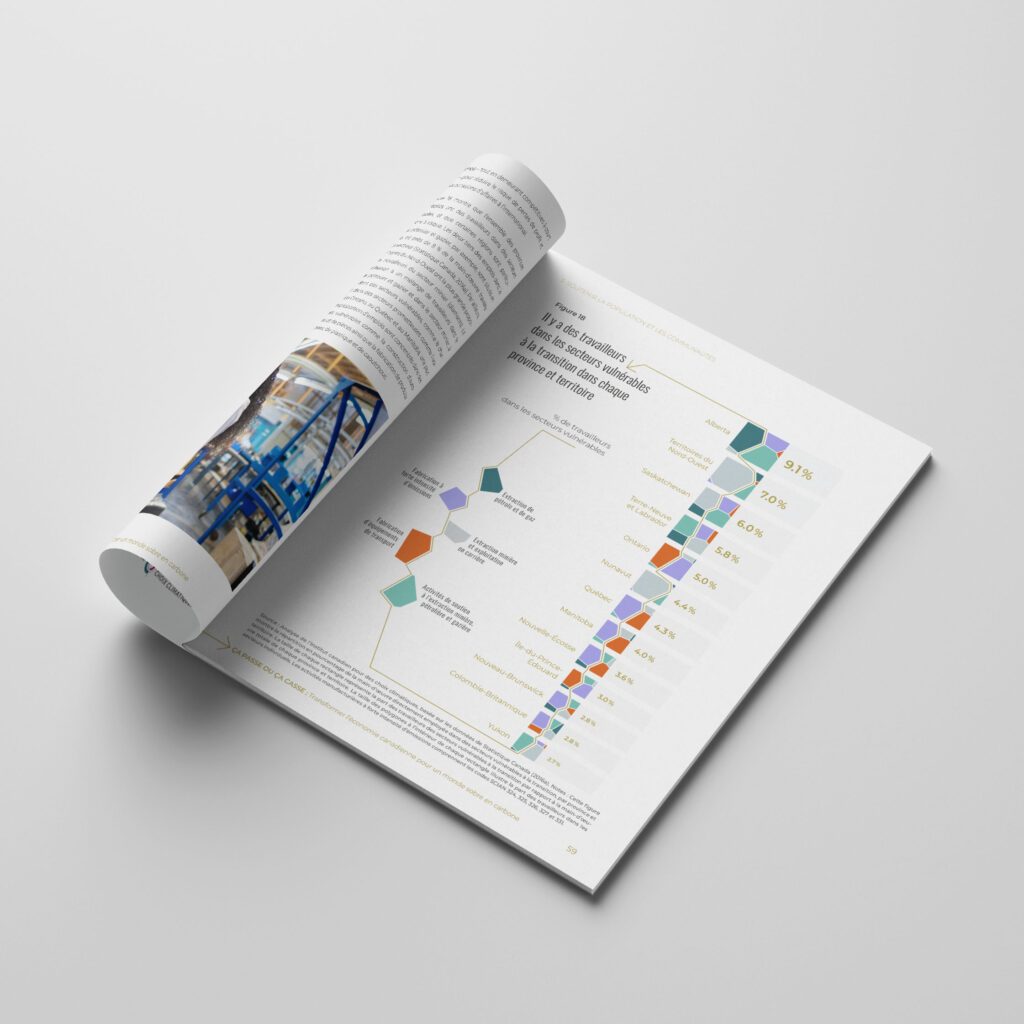
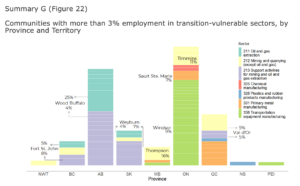
The next chart emphasizes the proportion of vulnerable workers and communities across Canada. Disadvantaged or weakened by their jobs in high-emitting sectors, also called “transition-vulnerable sectors”, these populations must be at the heart of government concerns with a view to protect against risks and opening up to new economic opportunities.
Drivers of profit change will influence adaptation
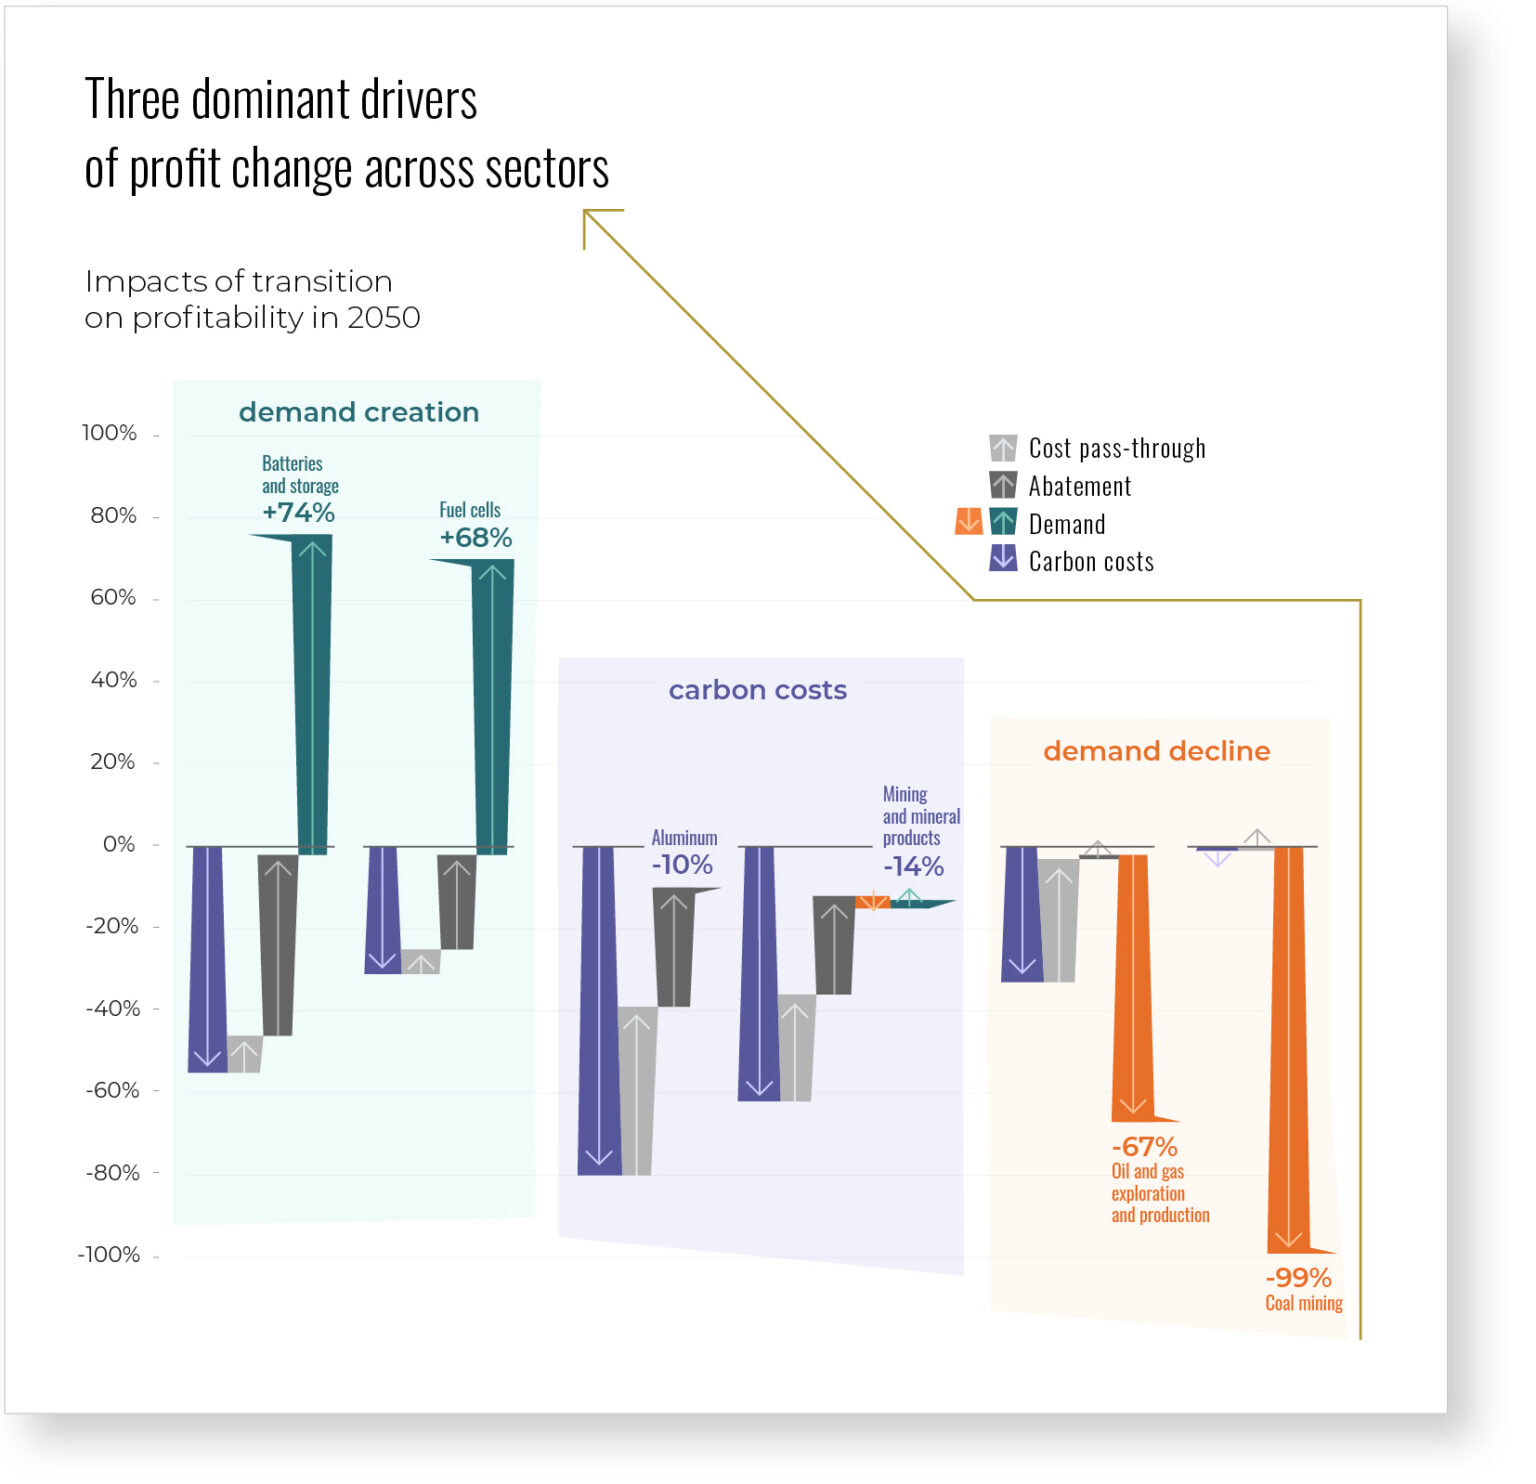
There are three broad adaptation strategies for Canadian economic sectors based on the main drivers of profit change: demand creation, carbon costs and demand decline. This chart highlights the type of profit change that some selected sectors will face.
Before
Developing sectors
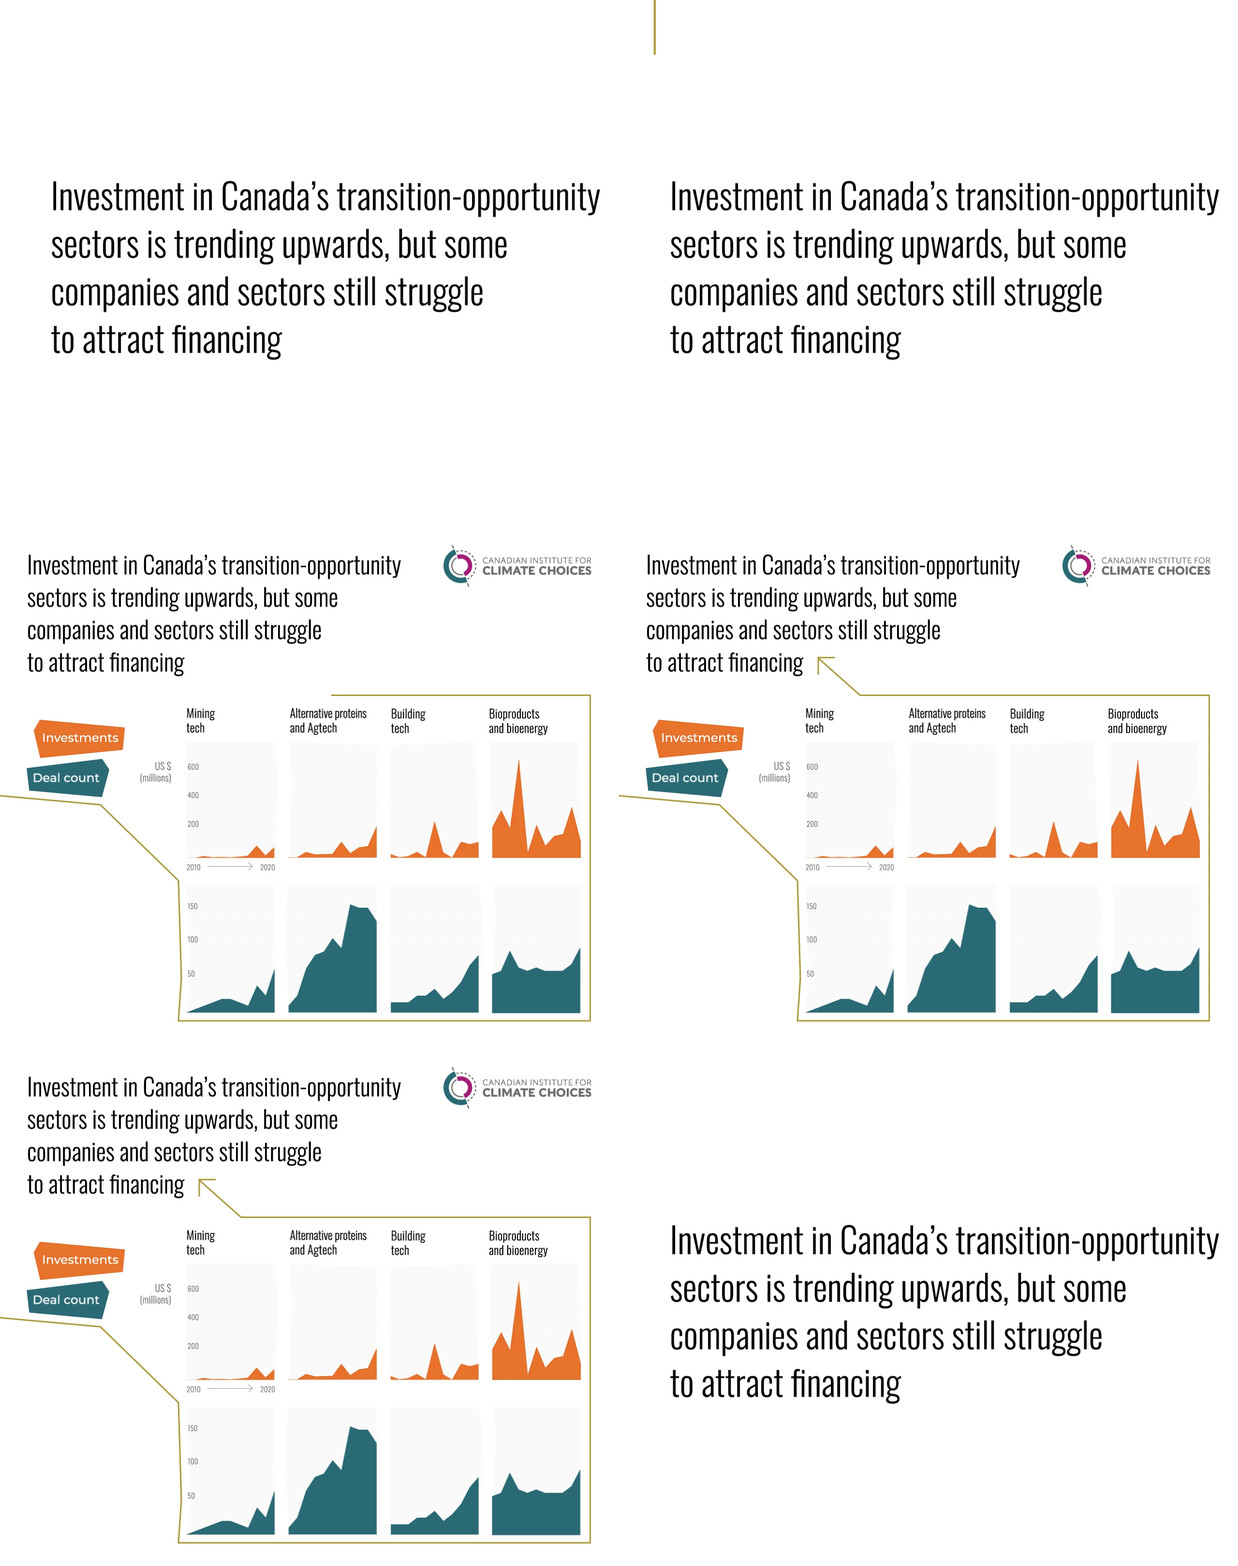
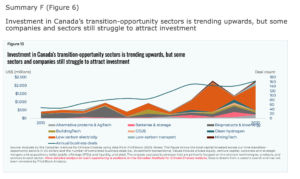
There has been a significant increase of investment towards transition-opportunity sectors over the last decade. However, those investments remain low compared to the overall economic activity and have been targeted rather unevenly.
To follow the evolution of each sector, we separated them in individual graphs while giving a separate scale to the one that received the most investment in order to emphasize the disproportion. In the animated version of this chart, the visual presents both investments and deal counts.
Vulnerable communities
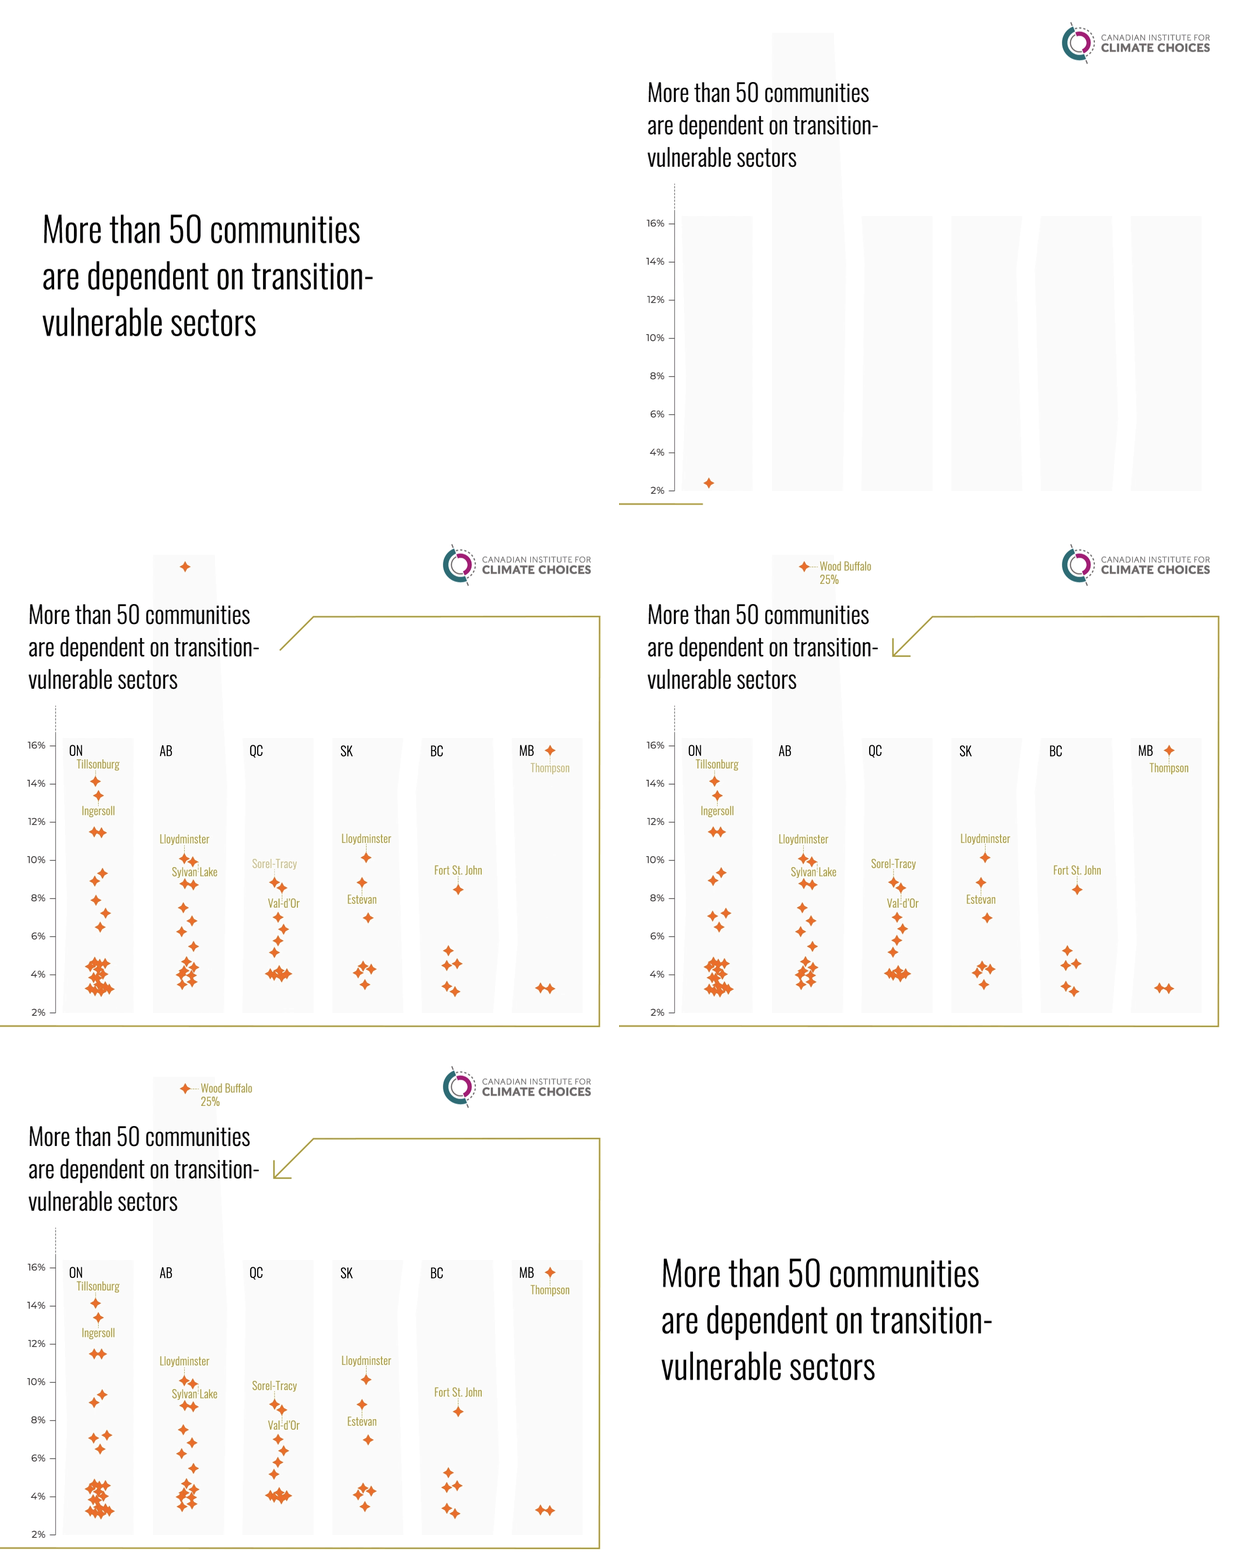
To counter the perception that climate change won’t affect most of Canada, the Institute studied over 50 communities that are economically dependent on transition vulnerable sectors, across provinces.
The visual shows each of the communities and what proportion of their workers are vulnerable. We played around with the layout to highlight an outlier and managed to keep the chart clear by slightly jittering the dots.
