Finding the Canadian path to net zero greenhouse gas emissions
The Canadian Institute for Climate Choices wrote a flagship report on the Canadian approach to the global quest to radically reduce carbon emissions to reduce climate change. They approached us to develop some punchy visuals that would clarify their findings and help give them wide recognition.
An interactive summary
The main deliverable is an interactive that explains the crucial finding: there are two types of solutions to reduce emissions and both of them are necessary, although they need a slightly different approach.
Our interactive takes the reader through the steps to understand what is net zero emissions and then how the Institute has organized the solutions and finally how they can be combined to reach the goal.
Click here to go directly to the interactive visualization.
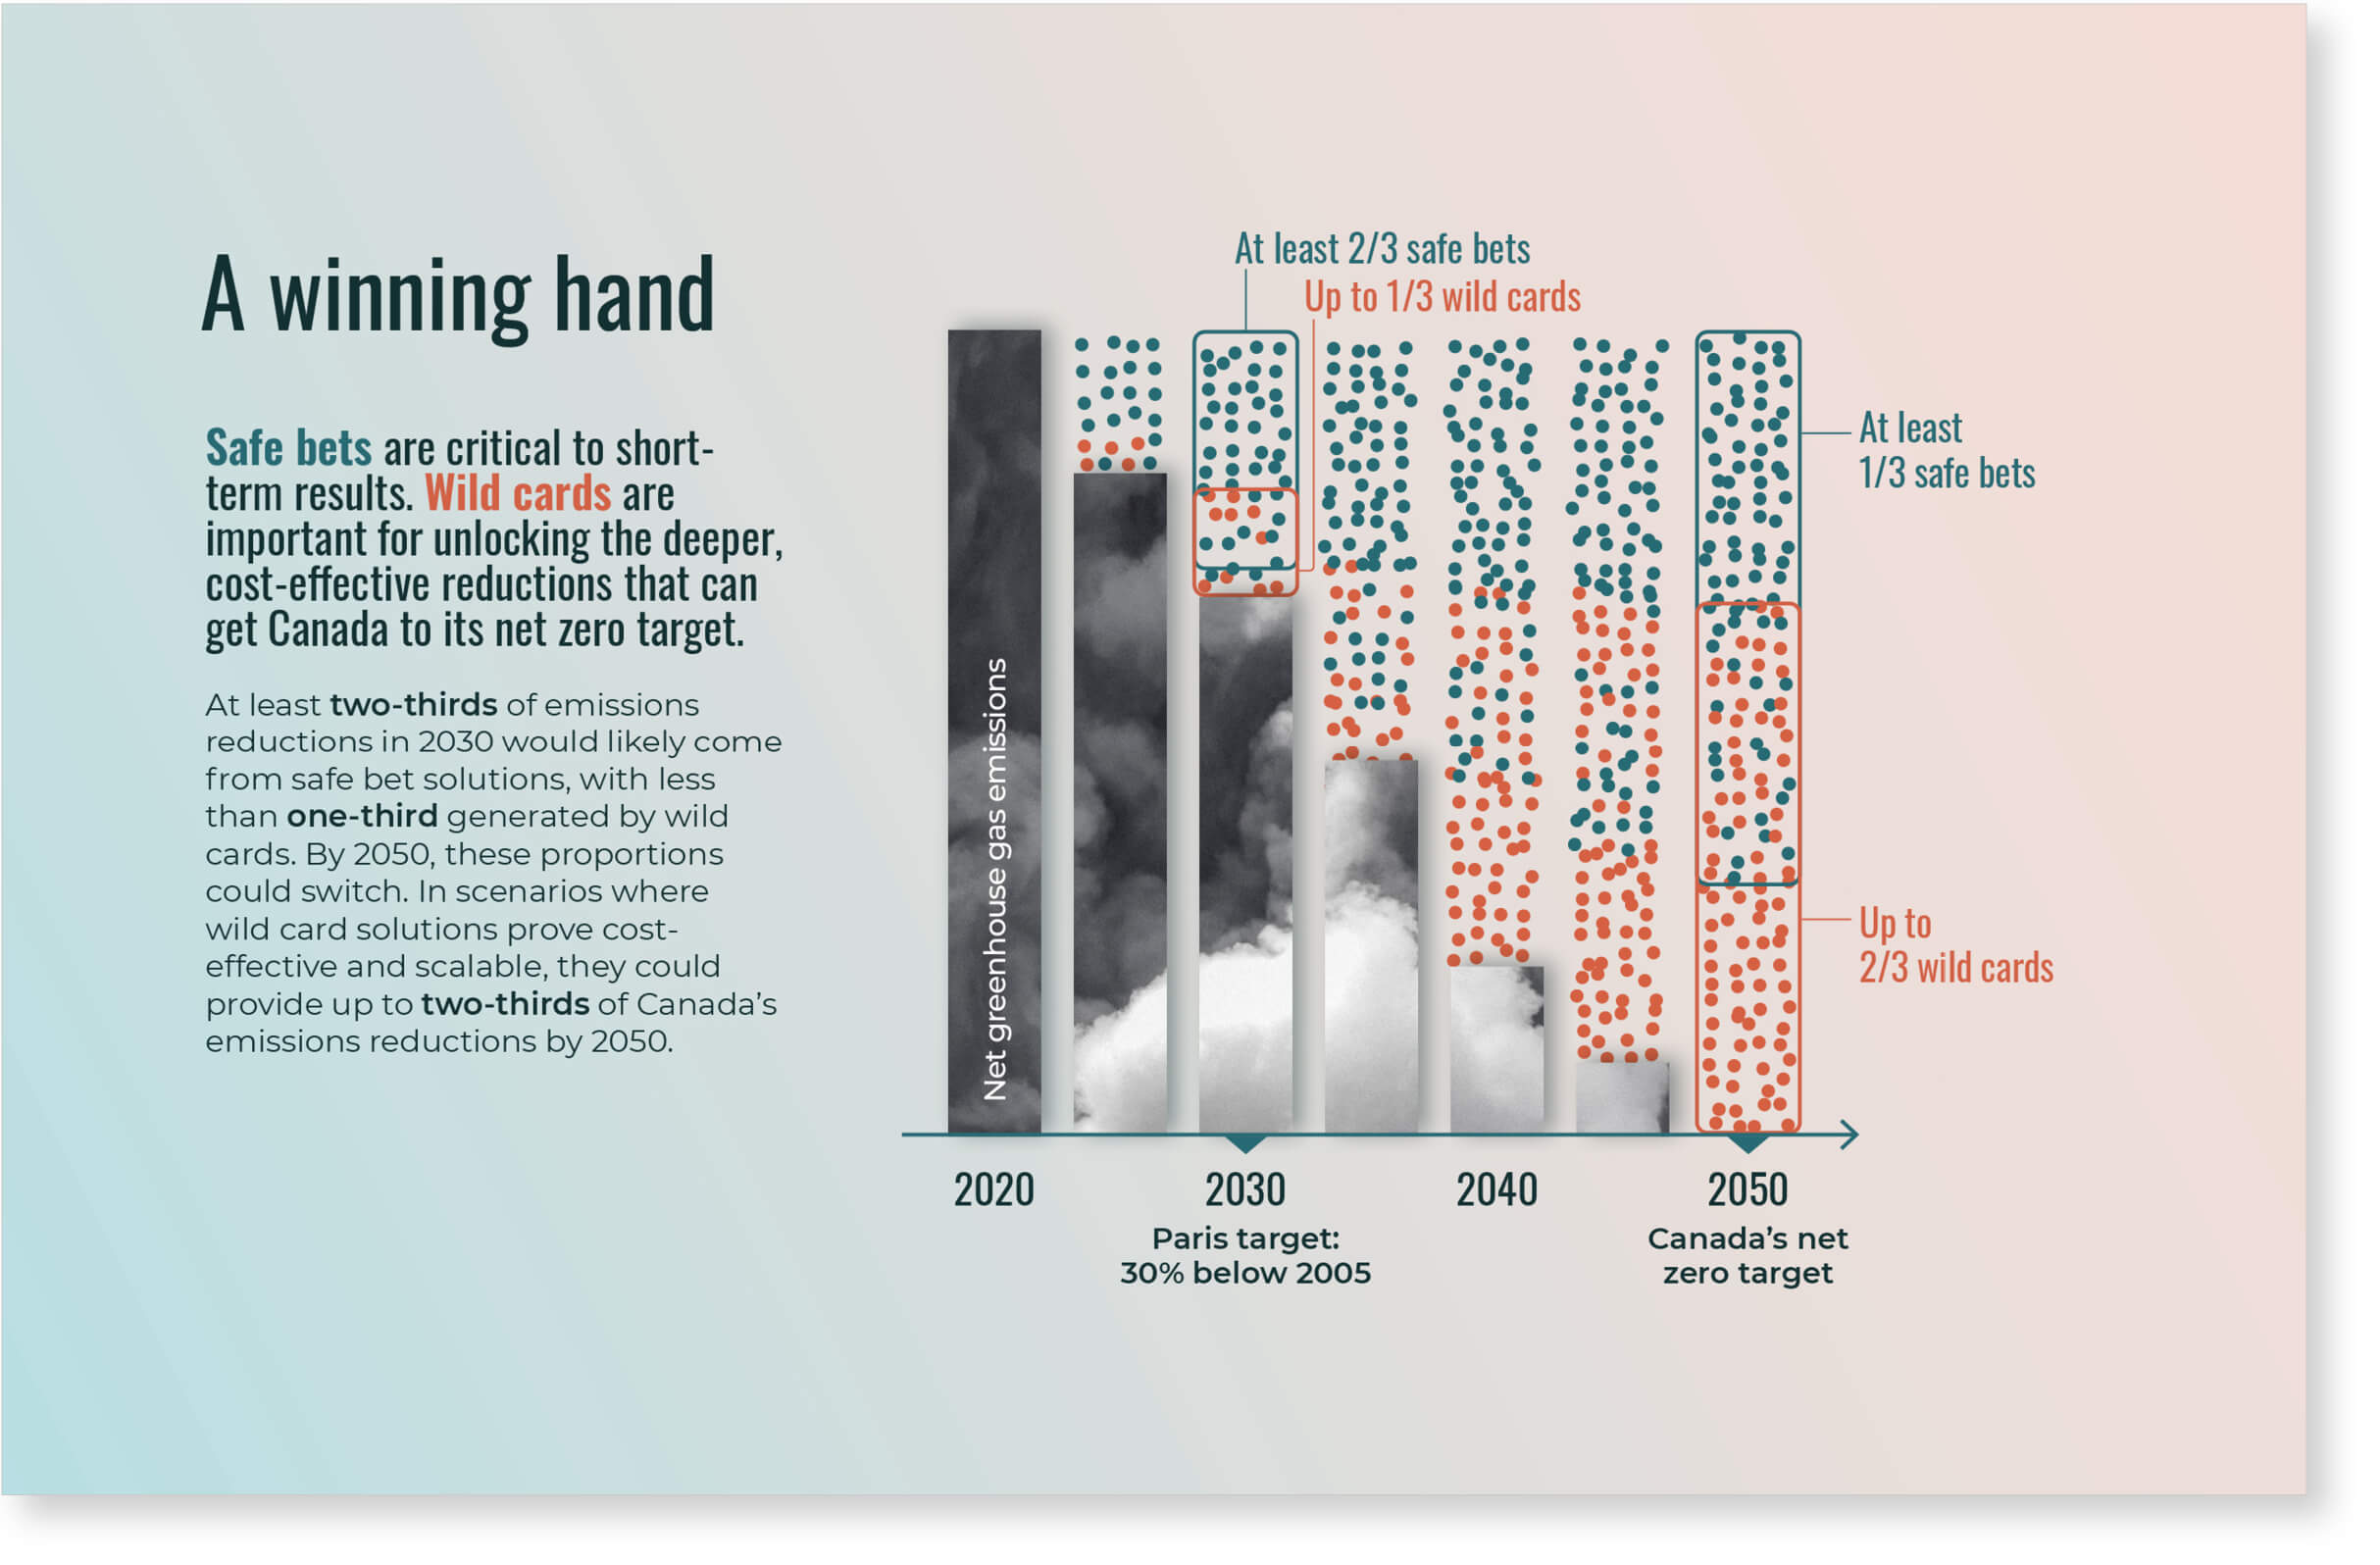
A winning hand
This is essentially a static version of the final visual in the interactive. With full annotations, it can be used in print to sum up the combination of solutions to achieve net zero emissions.
The bars with a cloud background represent the greenhouse gas emissions, something central yet rarely seen in graph about their reduction.
Before
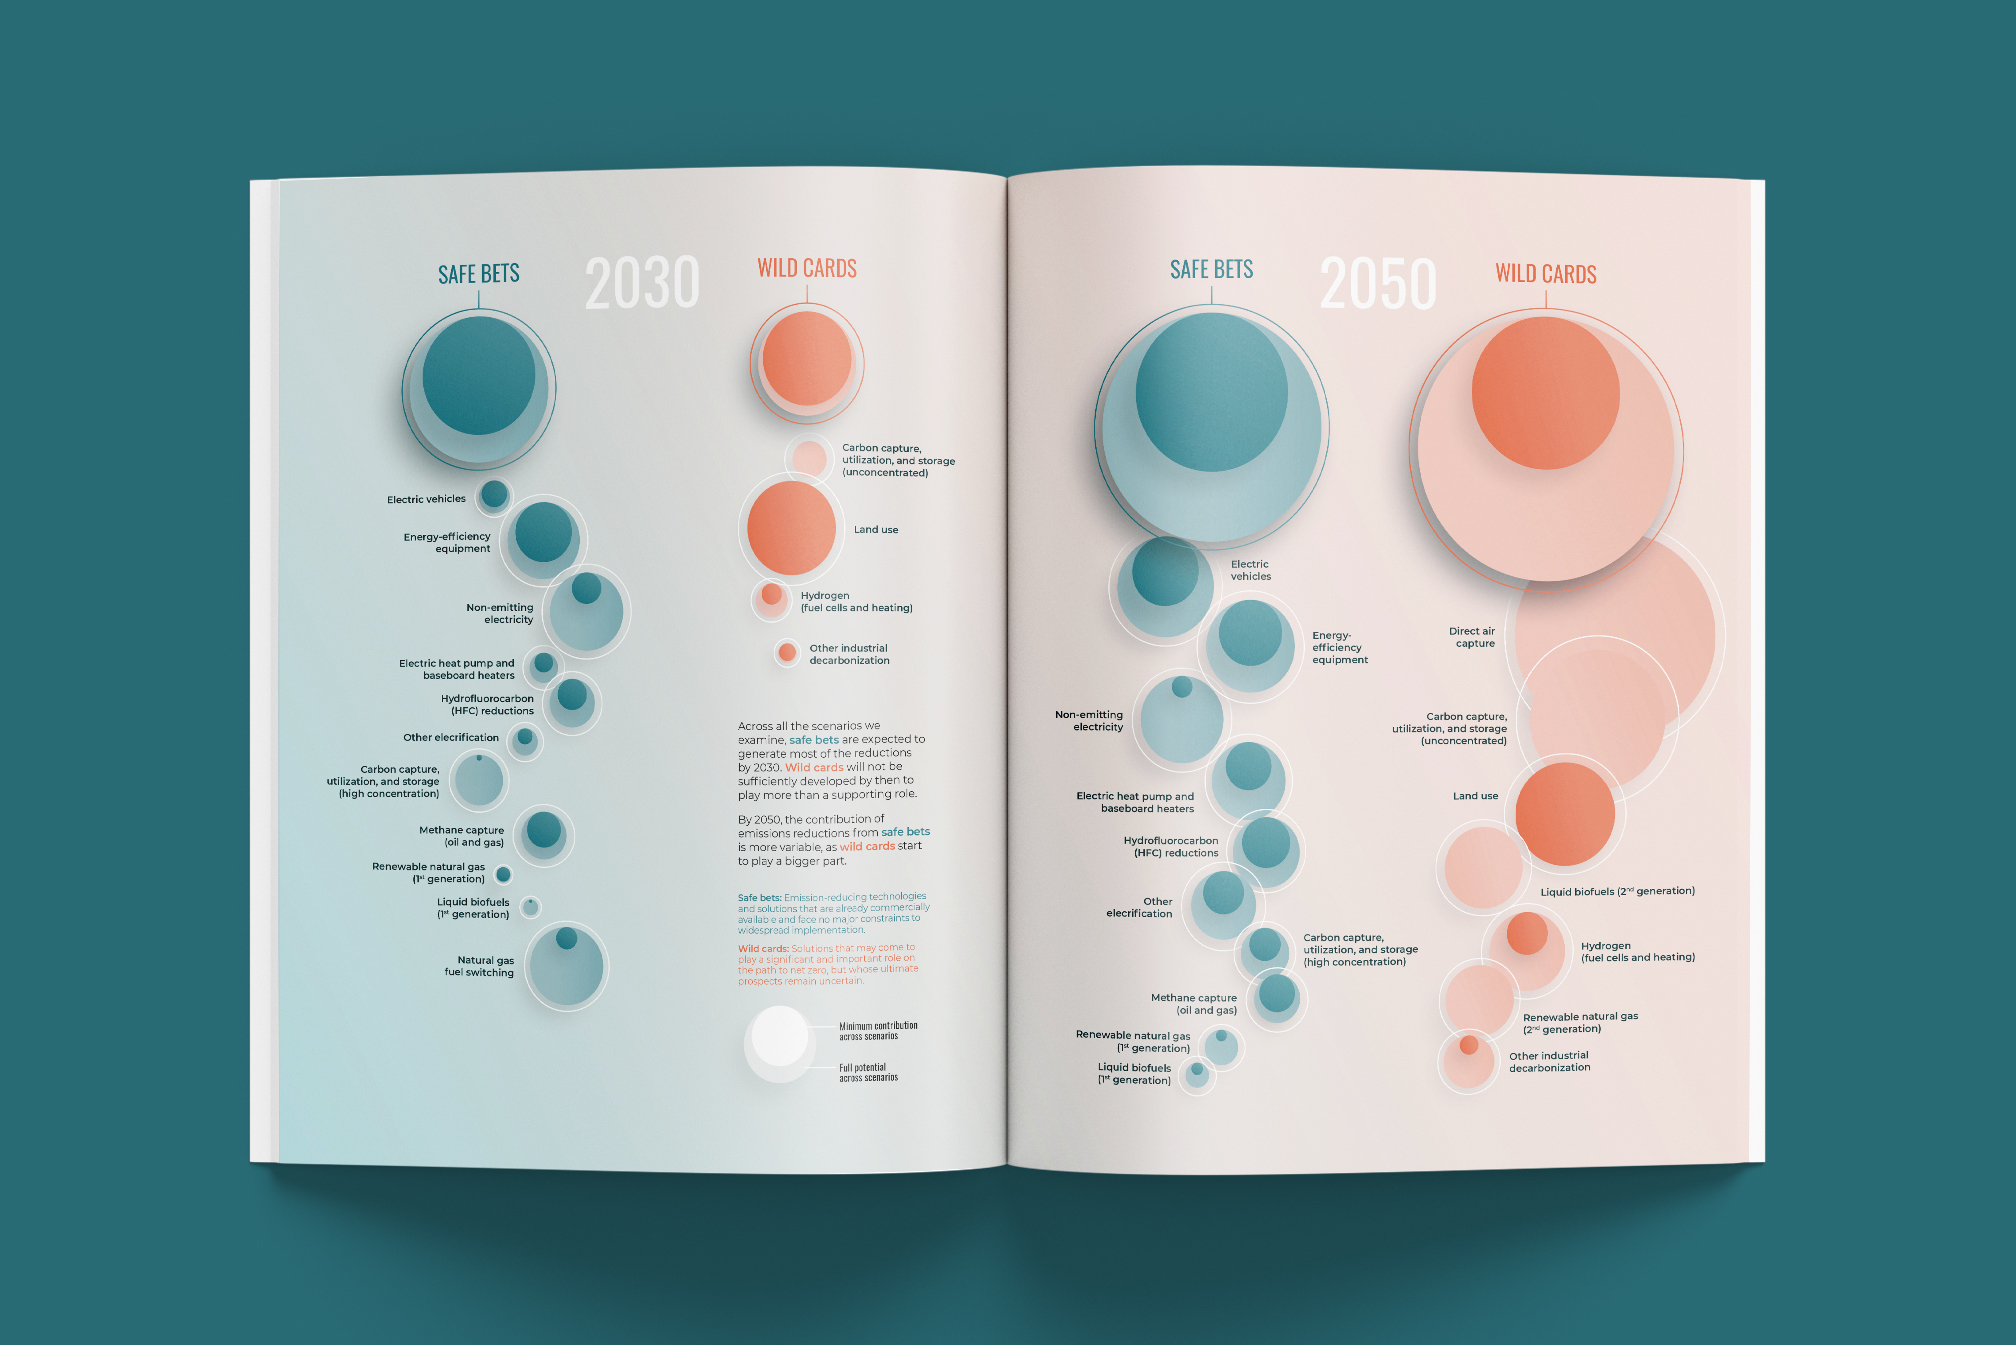
The pictures of 2030 and 2050
The combination of solutions will be very different in 2030 and 2050. The safe bets have immense potential, but mostly in the long run and none of it can be taken for granted. This visual is meant to convey the difference between the 2030 situation and that of 2050.
Before
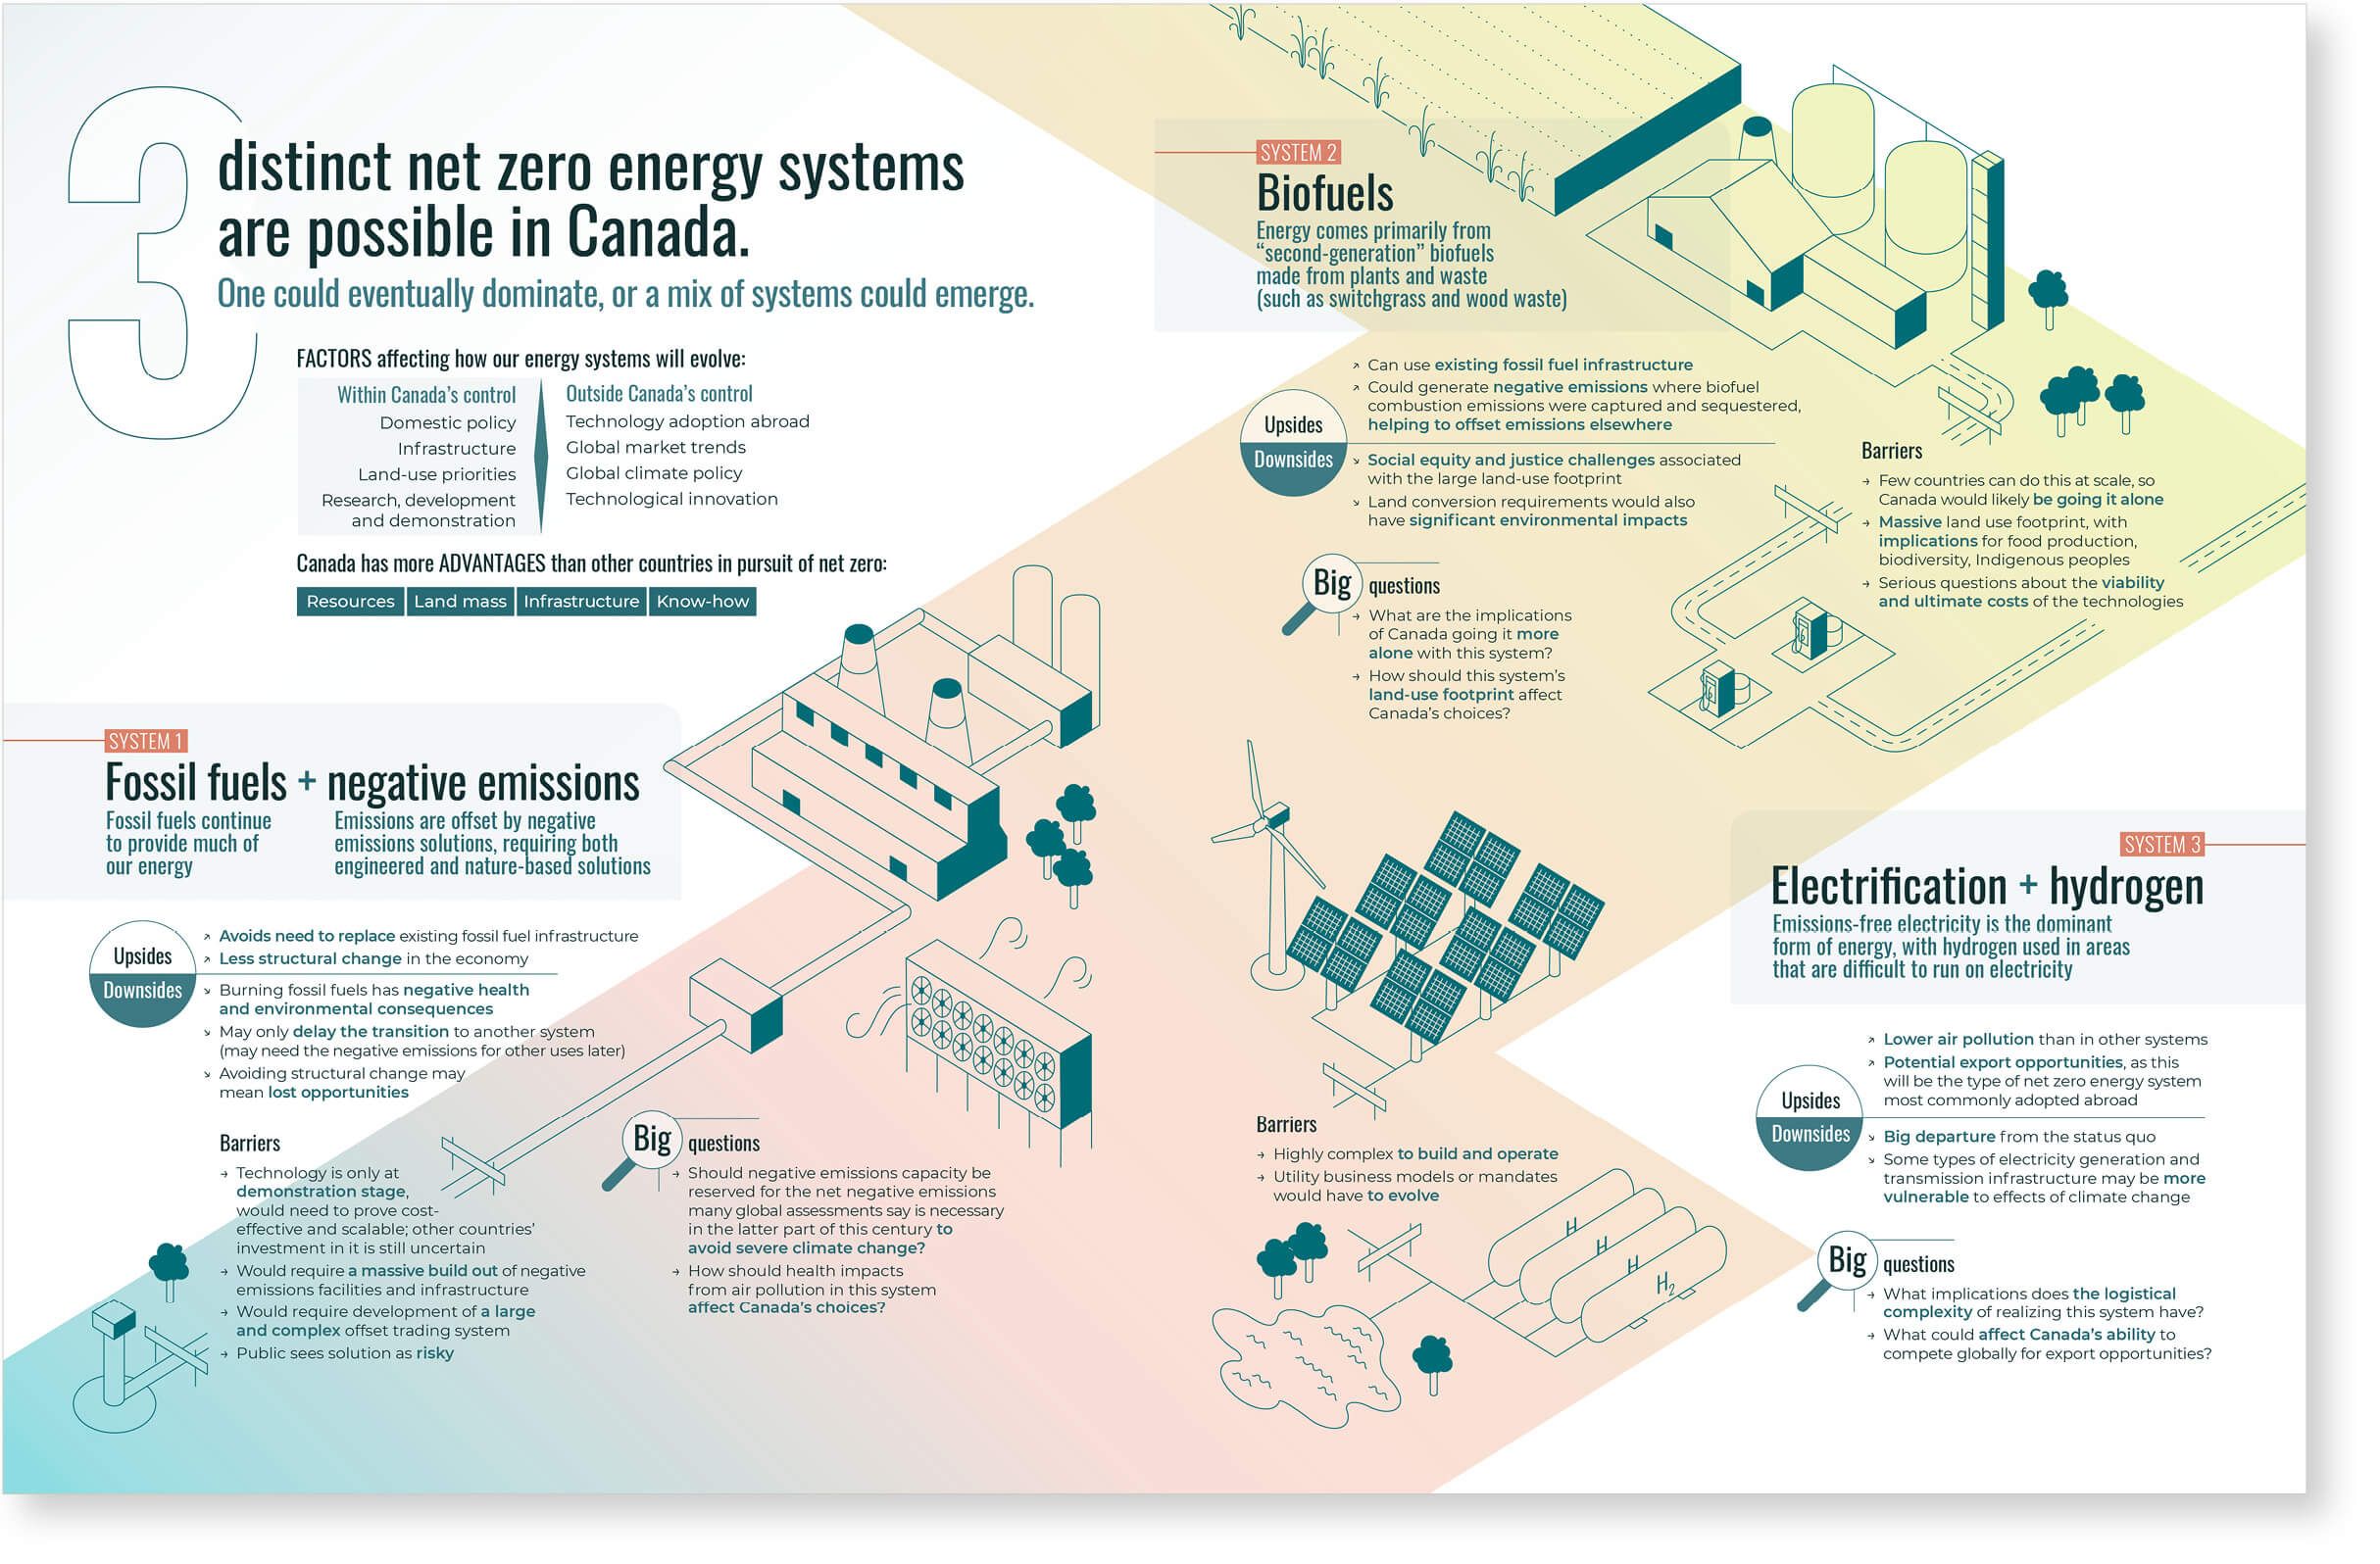
Three energy systems
The Institute images three main systems, i.e. combinations of solutions, for 2050. This illustration replaces a matrix in a table and brings to life these concepts. They are united on an isomorphic grid to allow the reader’s eye to fly from one system to the other.
Before
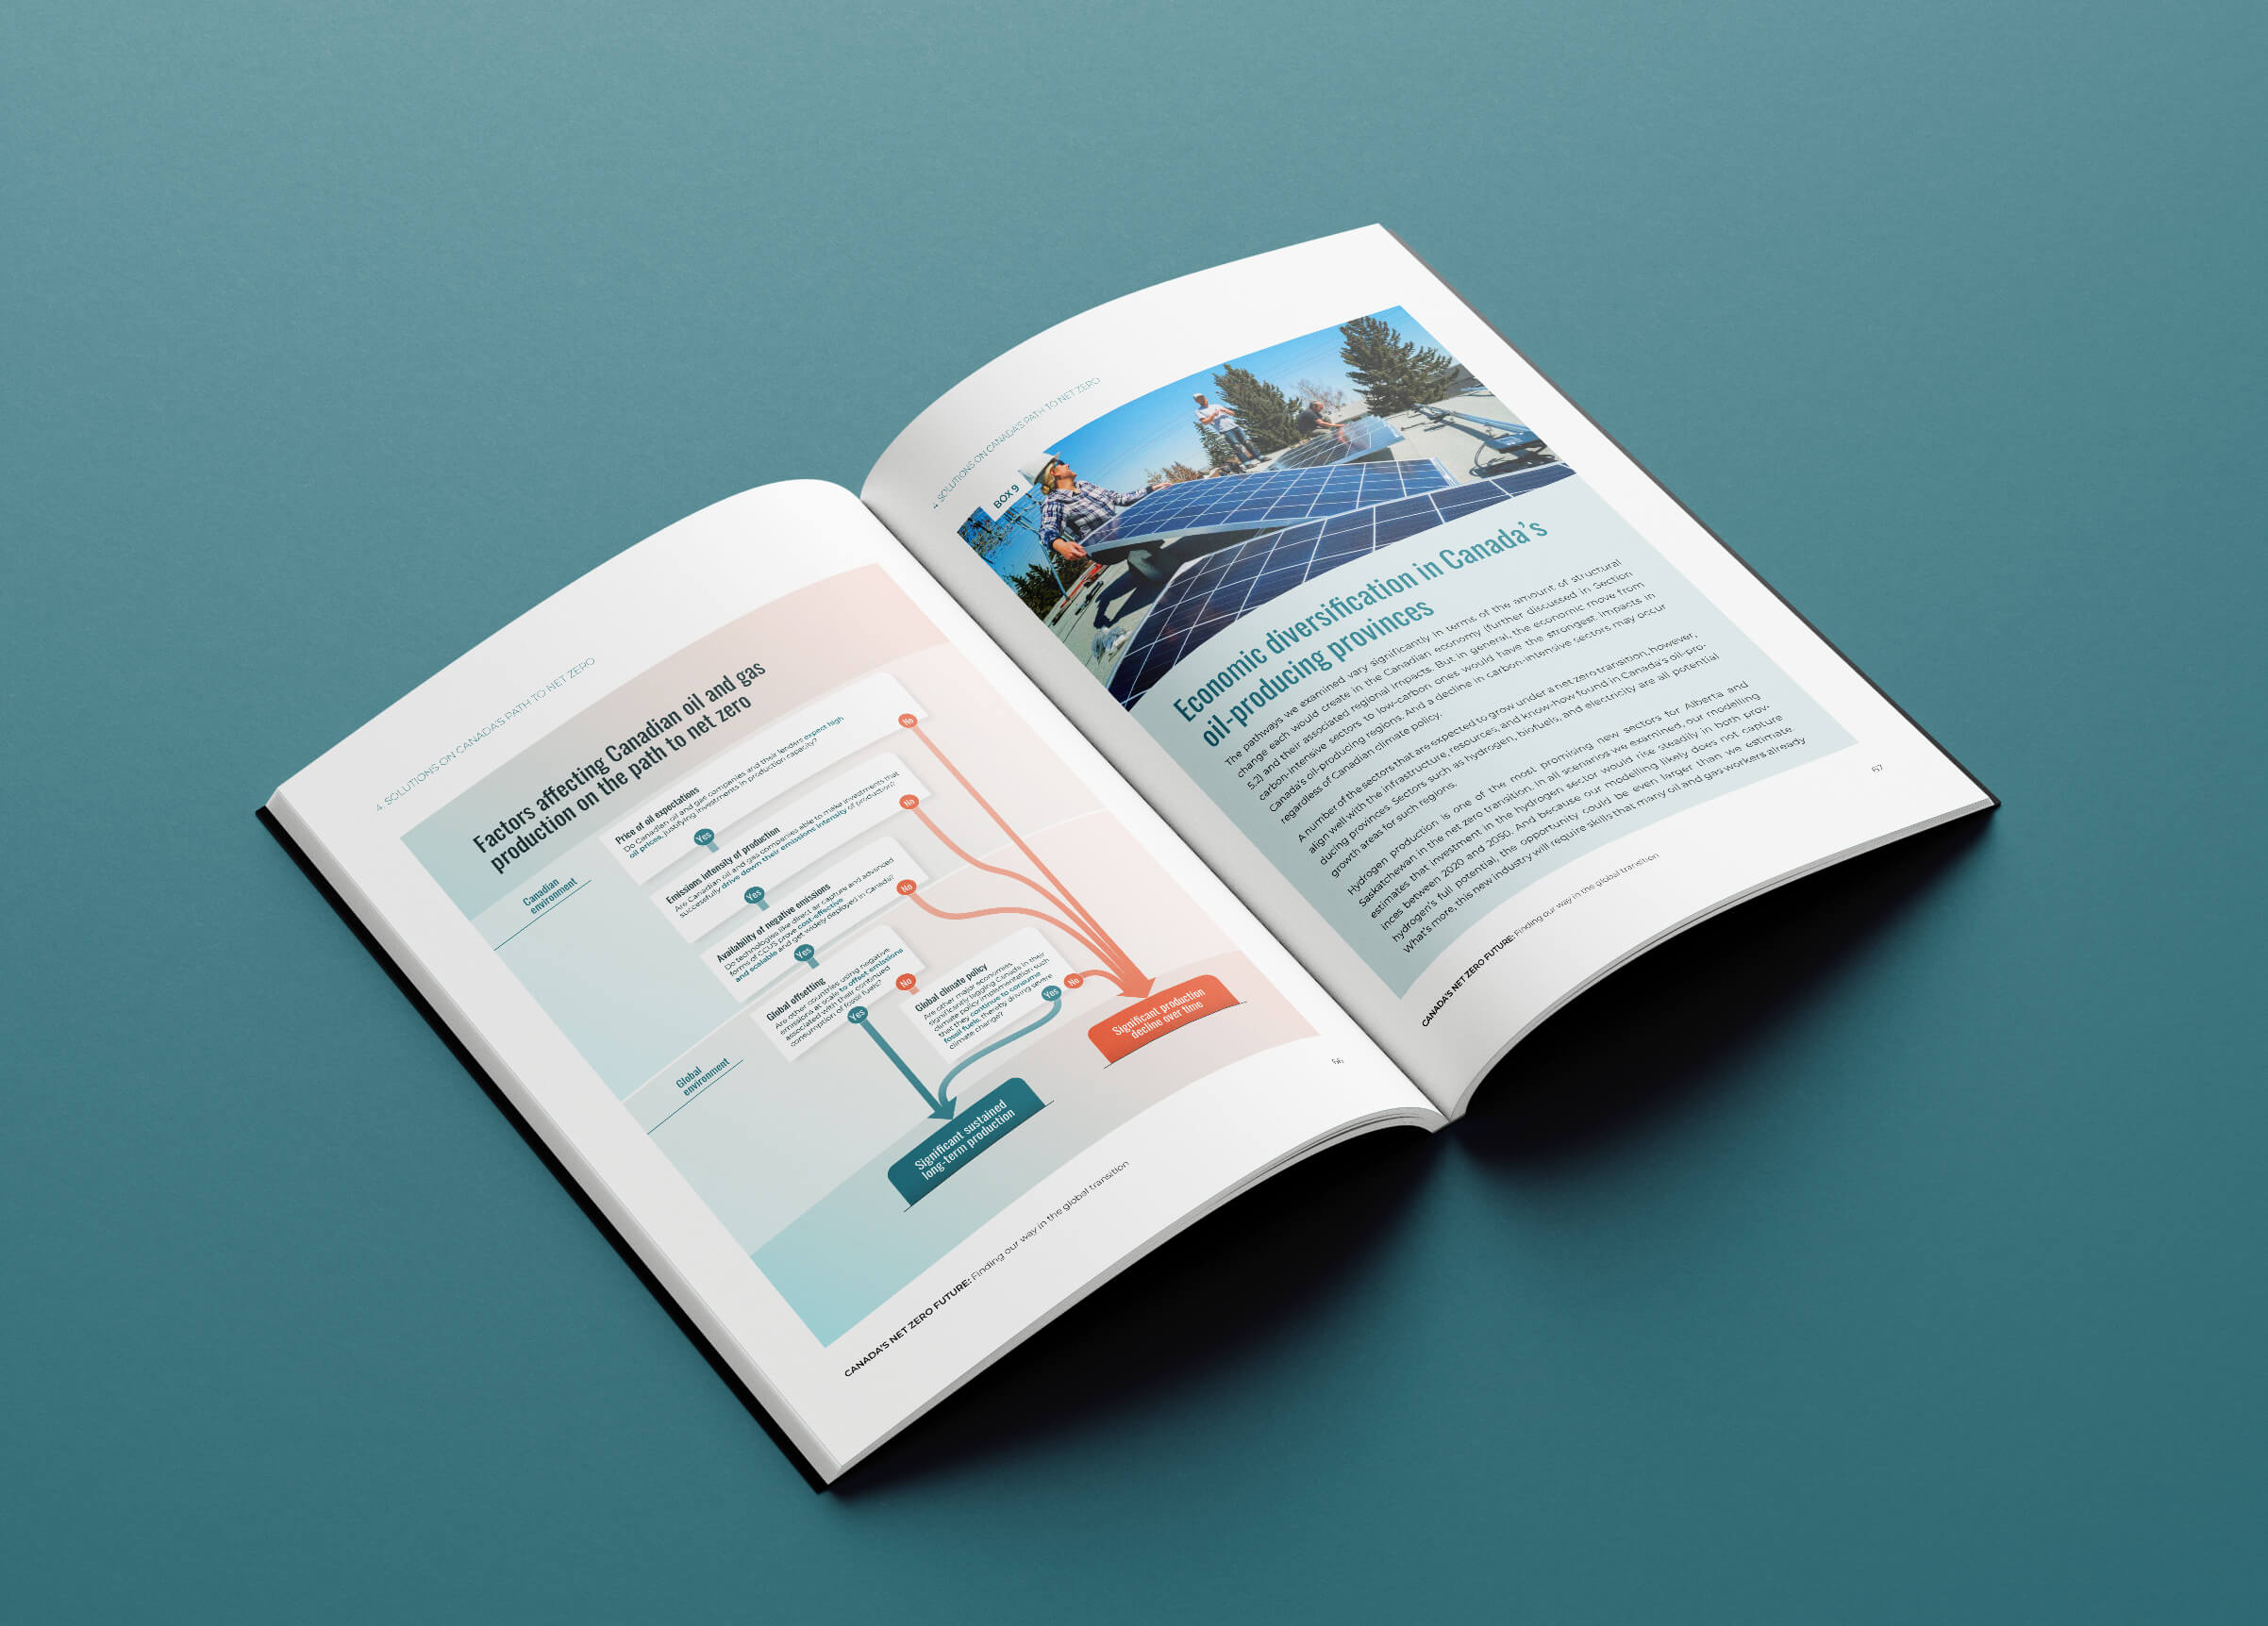
Factors affecting oil & gas production
Most interestingly, this decision tree started as an area chart. It became clear however that the main message was less about the projected levels of production and more about the conditions for each scenario. This decision tree shows the reader what is needed for oil and gas production to remain high in Canada over the next 30 years.
Before
The interactive
Here is the interactive presentation of the project. Scroll away!