A World Bank Group report finds that Bamako has an important opportunity to improve service delivery and expand growth that can lead to a more resilient and productive capital. With so much data to convey, the authors turned to us to find a clear way to communicate their findings and recommendations.
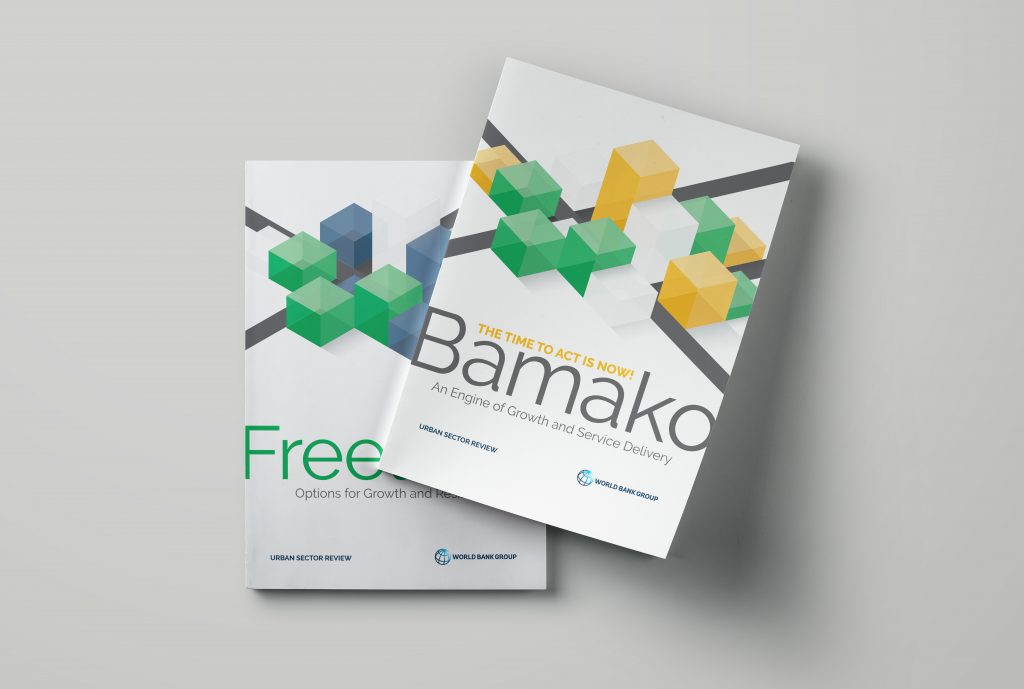
Cover page
The topic of the report is urban development: how can Mali develop its capital to its full potential? The report is full of measures and measurements that show exactly what is this potential and how to go about it.
The concept of the visual is a combination of cubes and streets representing both a city and charts.
The illustration is isometric, meaning that it does not have perspective.
Colours are taken from the flag of Mali to reinforce the visual association with the country. It also allows the concept to be used for the report of other countries. In the back, we see the version for Freetown, Sierra Leone.
The same visual theme is used throughout the report.
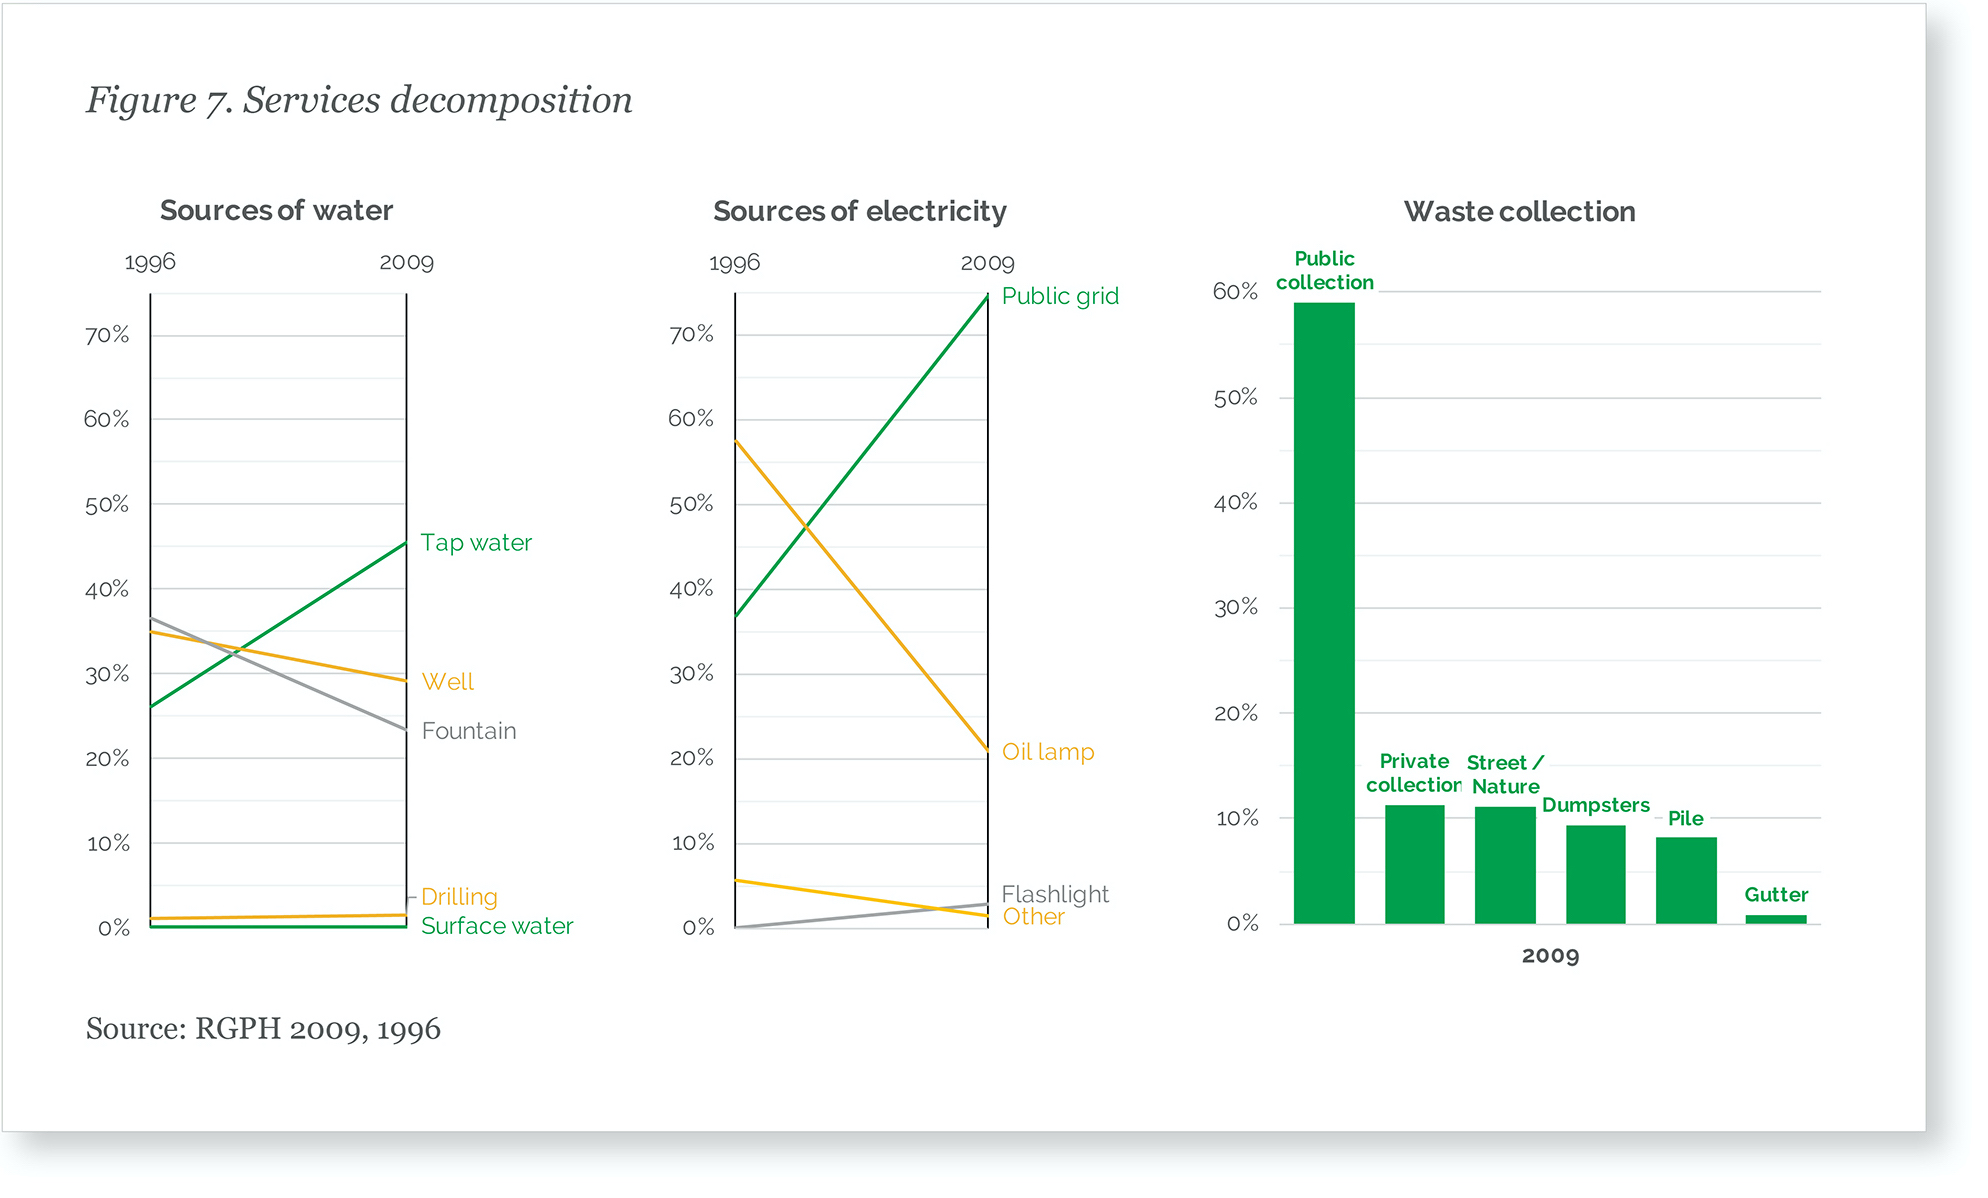
A story of improvement
Access to public services has improved between 1996 and 2009, although some services, such as access to tap water, remain limited.
The slopegraphs convey well the change of state over time. It is clear that the lines going up show an increase.
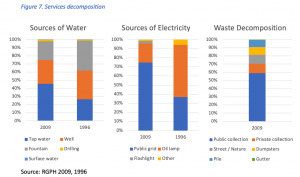
We have inverted the years from the original (below) because the convention is that time goes from left to right.
For the third graph, we have unstacked the bar chart from the original to allow a comparison of the different waste collection methods.
For all three, the legend is integrated into the graph.
Before
Breaking down the stories by city
One of the findings of the report is that people are limited in the geographical range of movement in several cities because they cannot afford other means of transportation than walking.The consequence is that several opportunities, for people as much as for businesses, are out of reach.
The original graph (below) made it easy to compare the share of walking as a transportation mode, but nothing else. The text accompanying this graph, comparing several other modes, makes it clear that a visual analysis of each city was required. We used small multiples to give each city its bar chart.
Bamako is in the fifth chart because they are the fifth city in share of walking.
The order of the transport modes is that of the average of all cities.
Before
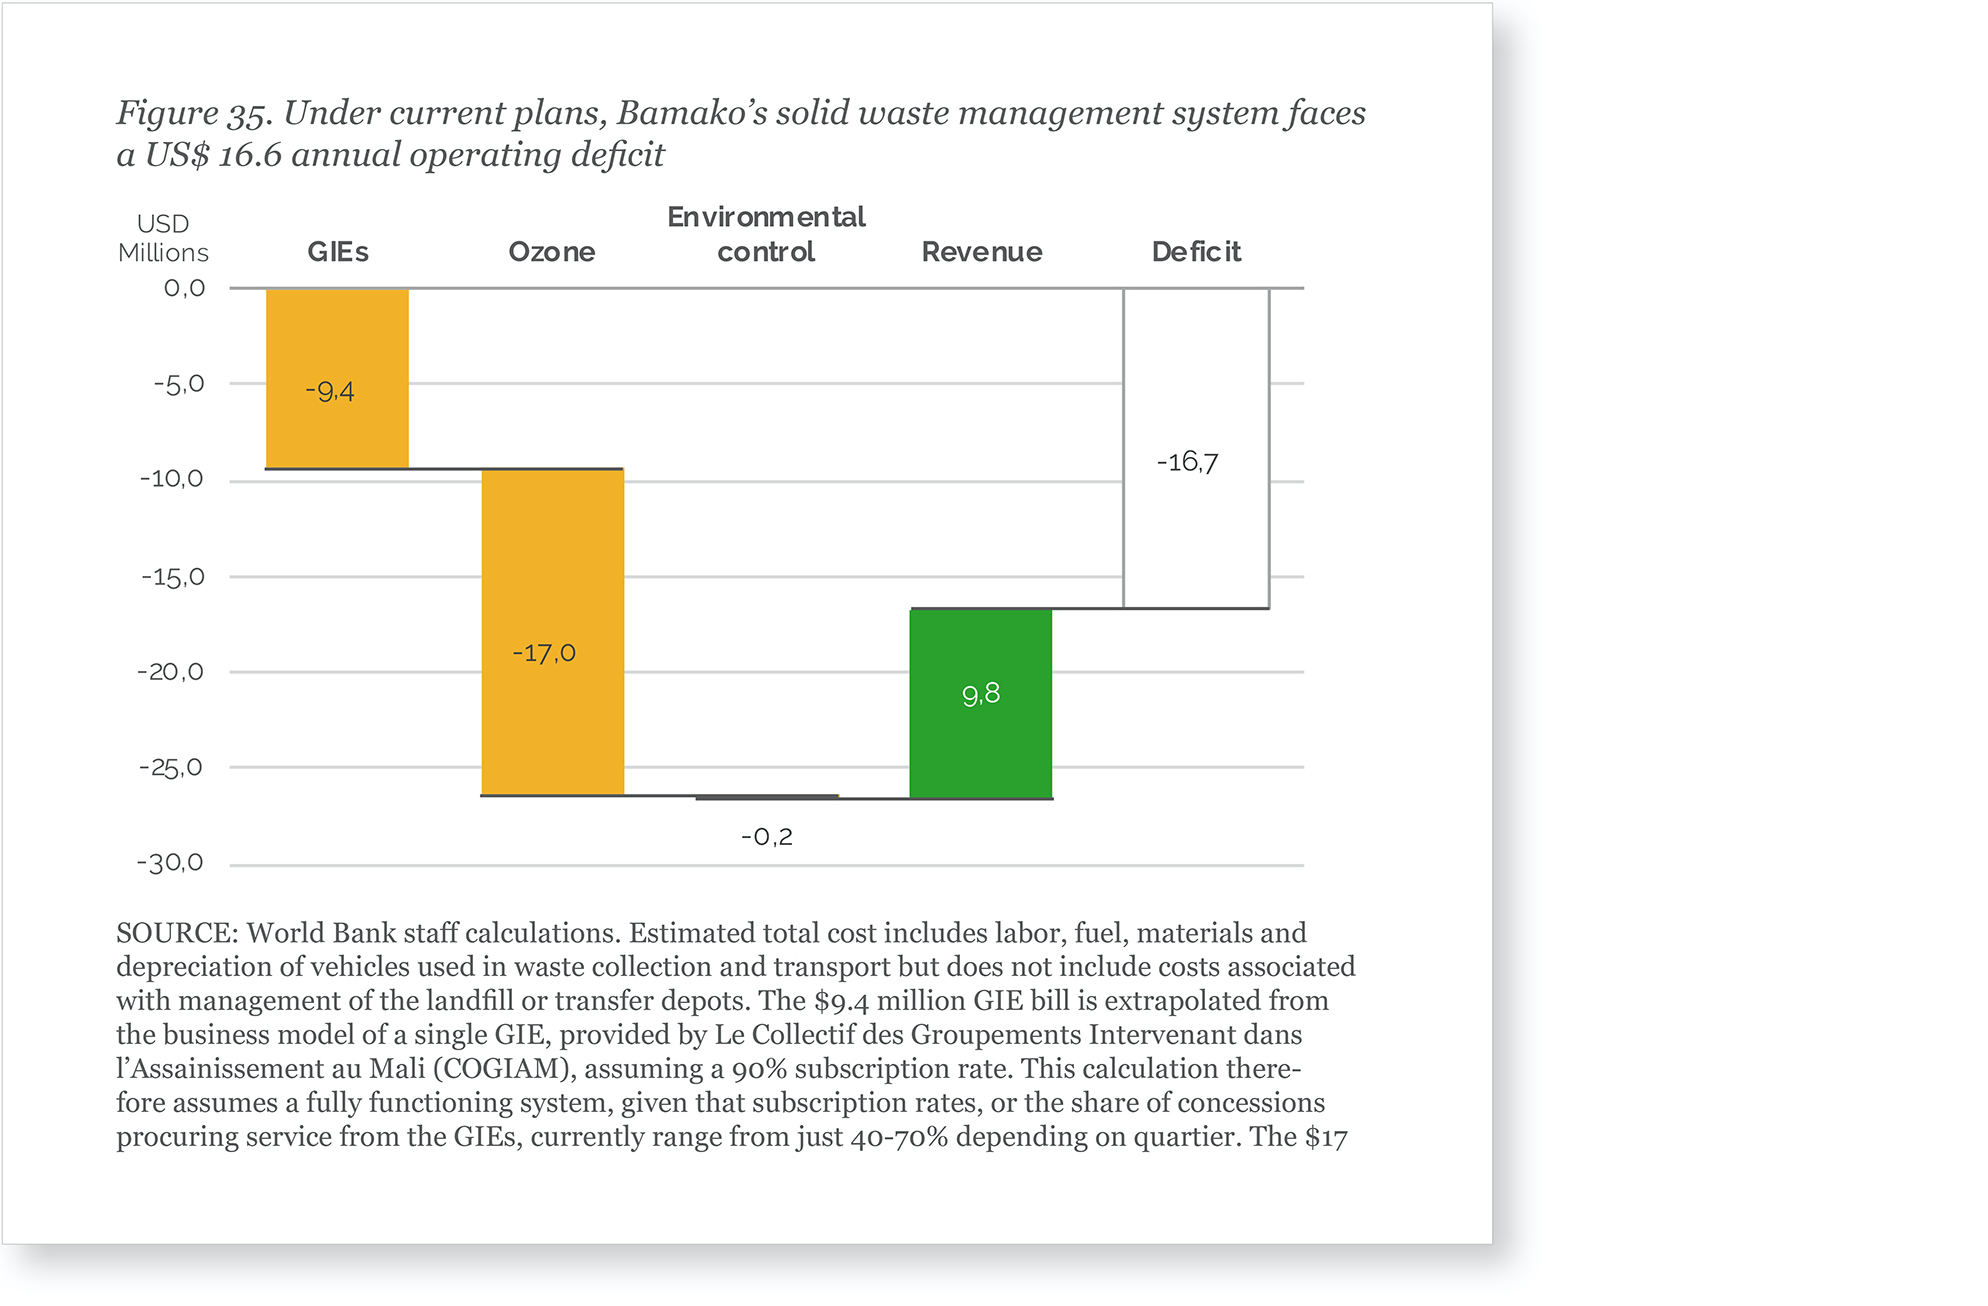
Expenses, revenues and a deficit
The operating costs of Bamako’s solid waste management are higher than their revenues, resulting in a deficit.
A series of expenses and then revenues can be shown as a sequence where the expenses drive the deficit deeper and then the revenues reduce it, all leading to a net result.
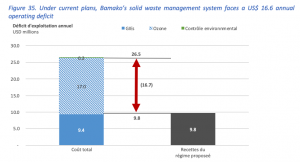
The original (below) made it difficult to understand the operations leading to a deficit. The close values of one of the expenses and the one source of revenues also made the graph more confusing.
Before
Fast and cheap
The analysis revealed that the SOTRAMA — vans for public transport — are cheap but inconvenient. The time it takes a fictional character to go on a six kilometer trip is much longer than it would take with other modes, such as the (expensive) taxi or the (cheap) teliman, motorcycle taxis on demand.
The main message was that the SOTRAMA was taking much longer, so the visual was created to make that point most visible, at the top. The Teliman appears as a much faster commute thanks to its short line.
The icons in the original did not fit together because of their various levels of details (compare the car to the motorcycle for instance).
Historically, the East of Montreal is a region that has been less developed and less well served than the Center and the West. How can we mobilize political actors to restore equity?