The World Bank has developed a first-of-its-kind methodology to account for the value of nature in economic models. We worked with them to showcase the connection between biodiversity and economic development, the economic impacts of a collapse of ecosystems, and “nature-smart” policies that provide the best way forward.
Making the (visual) link between nature and economics
We wanted to create a timeless and elegant design that embodied the relationship between nature and the economy. We settled on an abstracted version of an abacus, a calculating tool that has been in use since time immemorial. We added some visual connections to nature with vibrant colours and pictures, including animals, plants and the whole planet Earth.
Guiding the eye through complexity
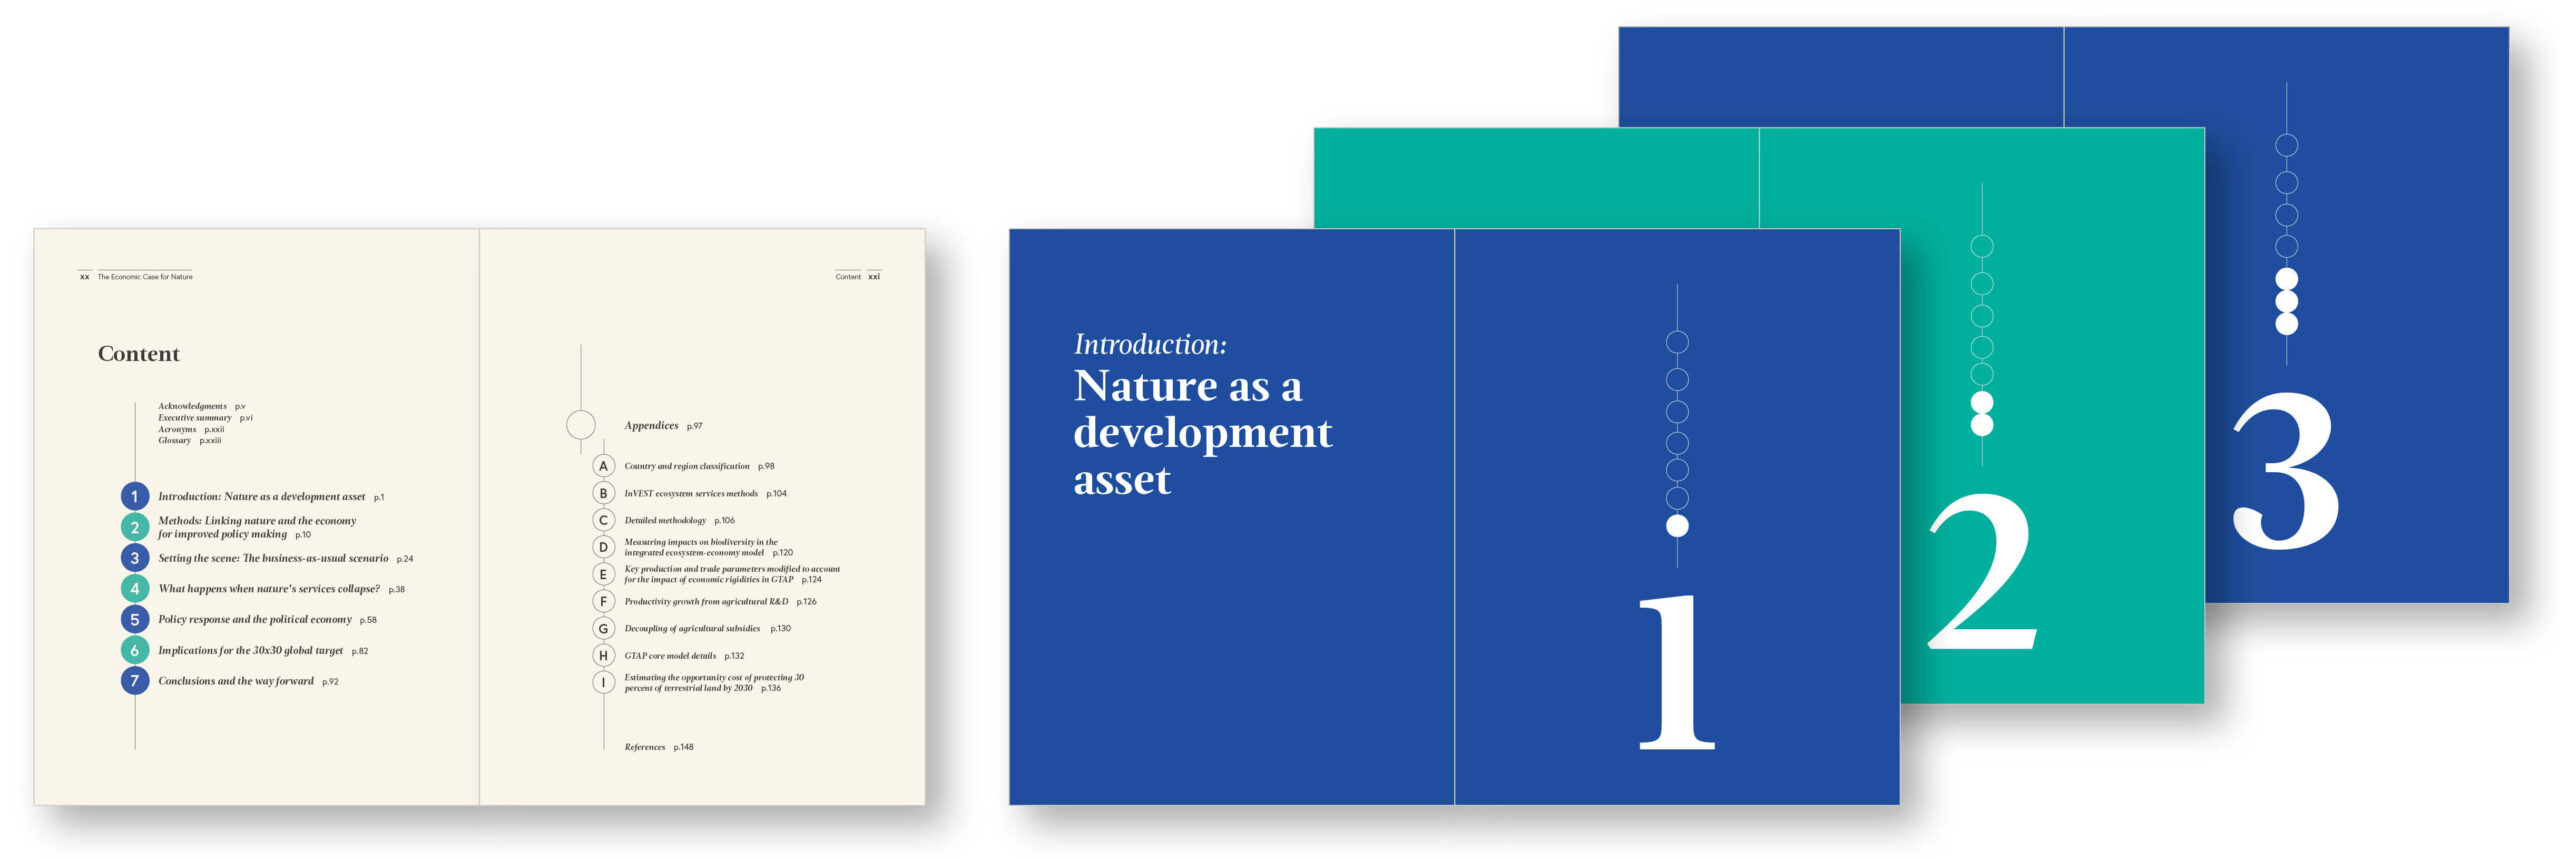
To guide the reader through the main structure, we alternated chapter colours and played around with our abacus concept to add progression dots.
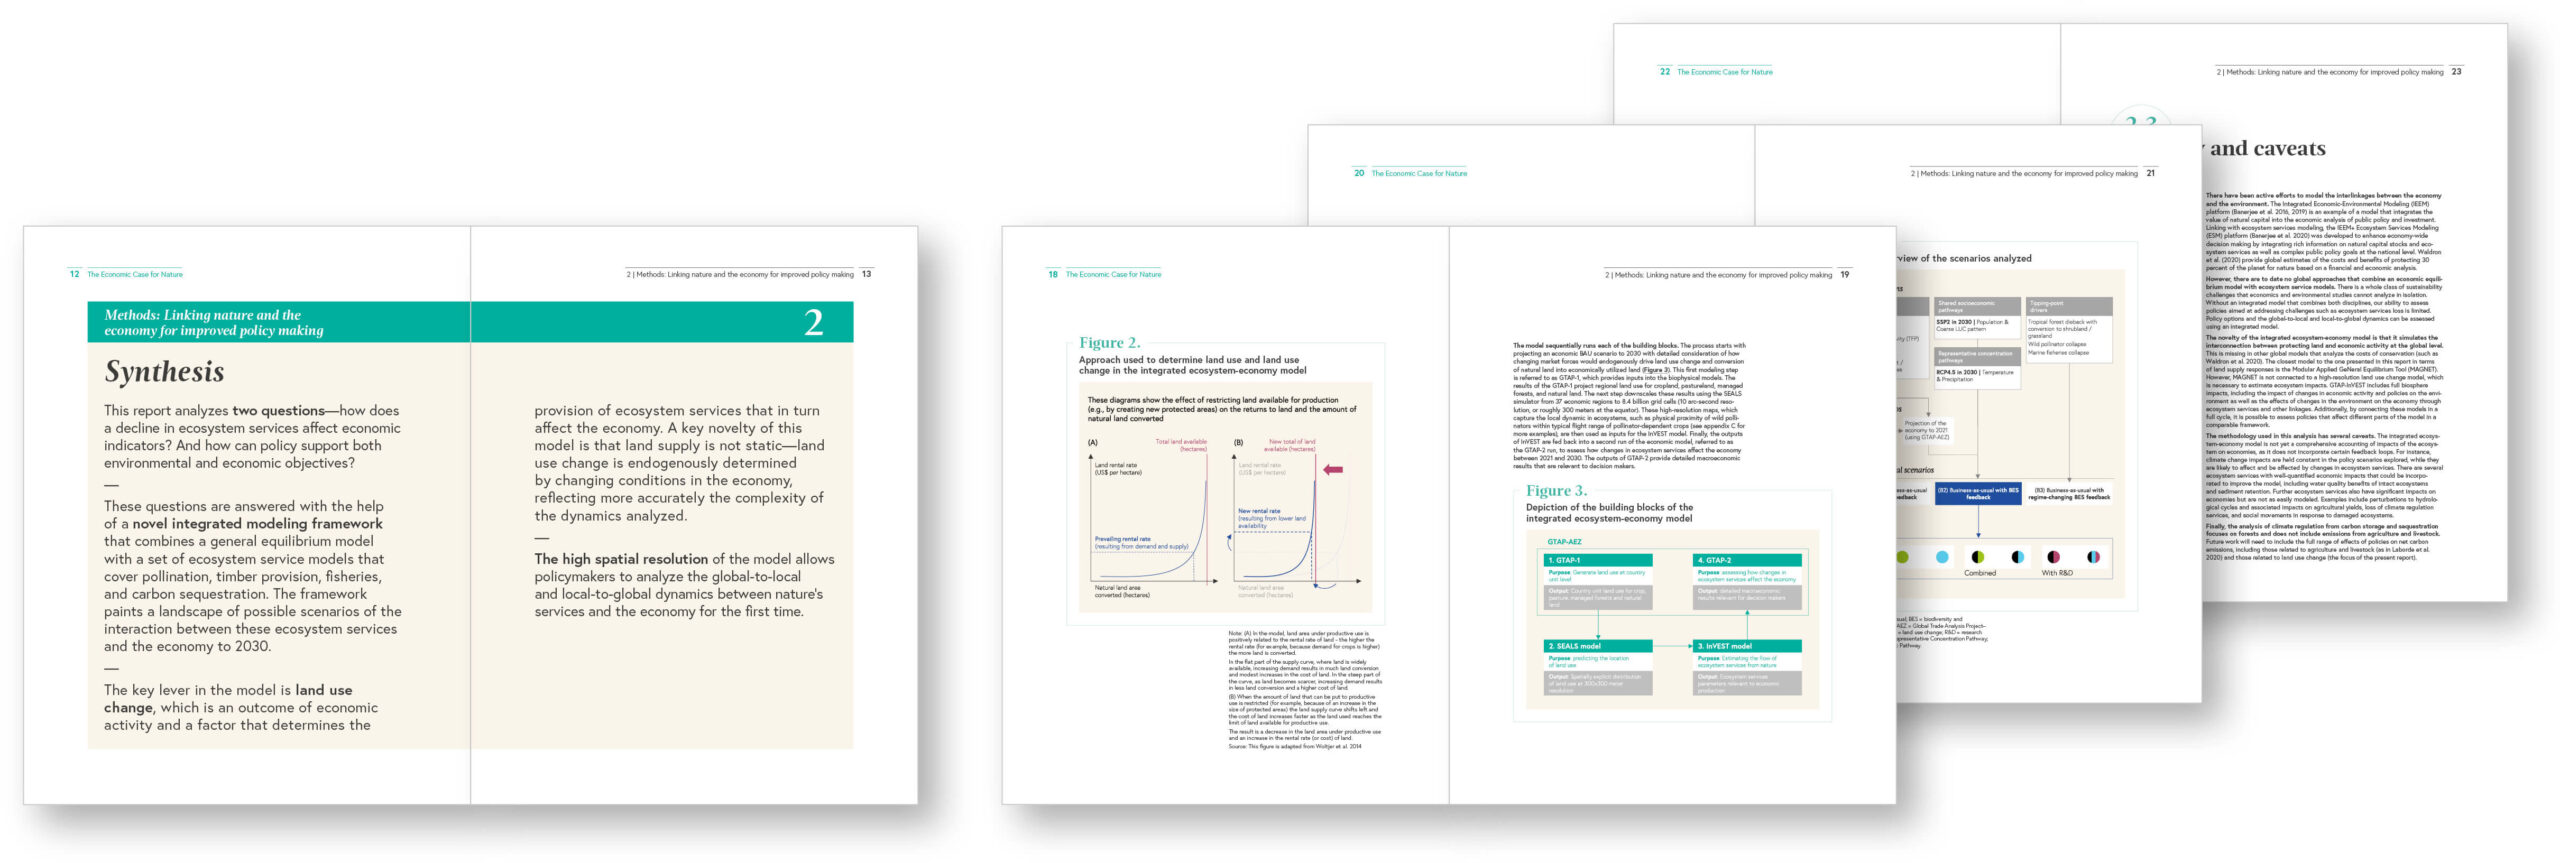
Each chapter starts with a synthesis differentiated from the rest through colours, borders and font sizes. Within each chapter, we emphasized the visuals (charts, maps and diagrams) with background colours and wide margins.
A matter of weight
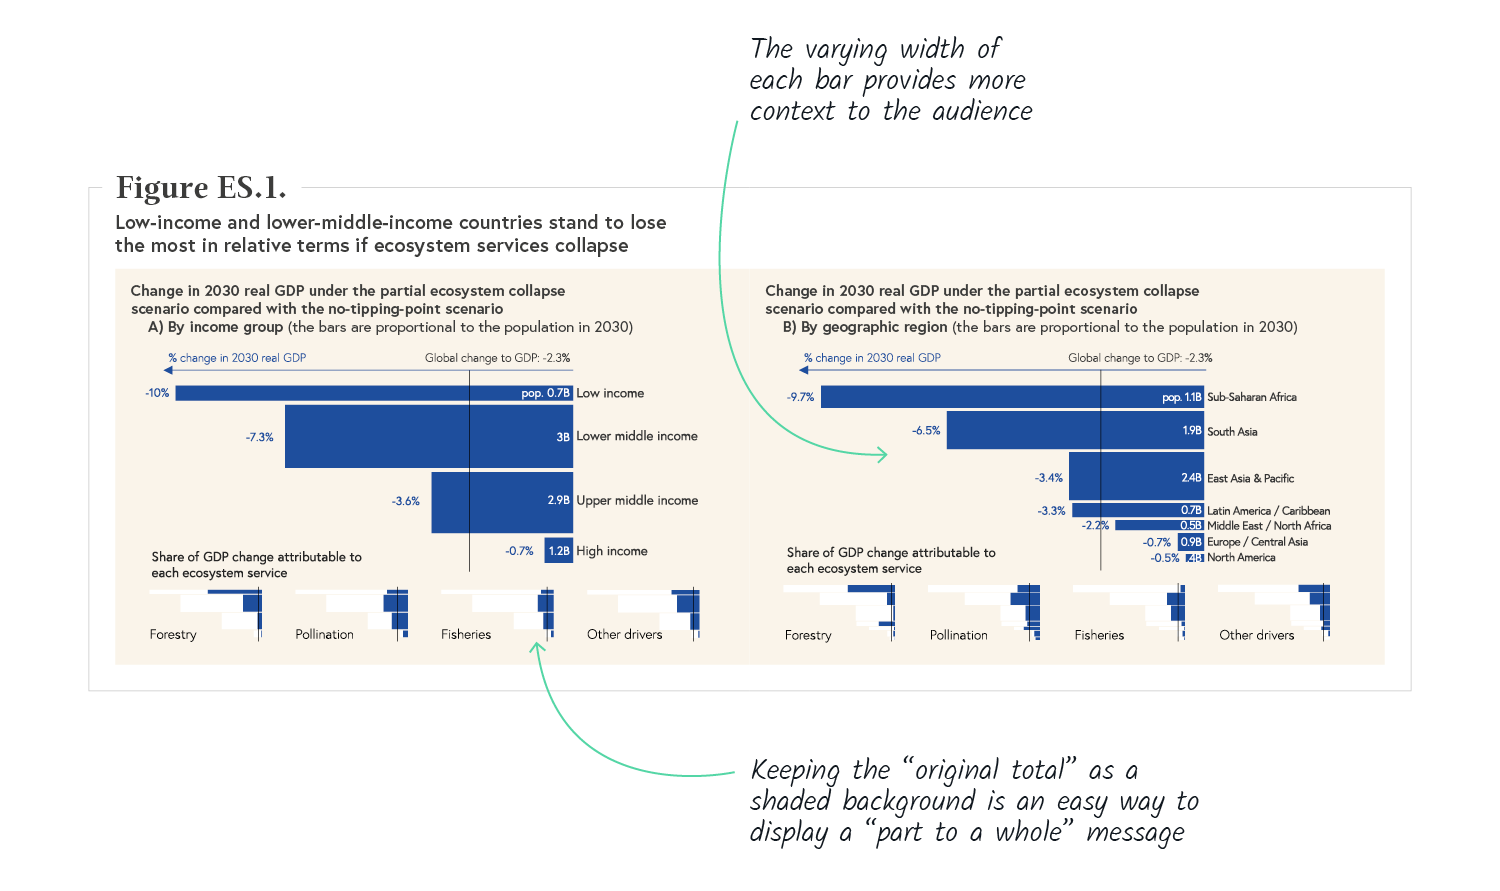
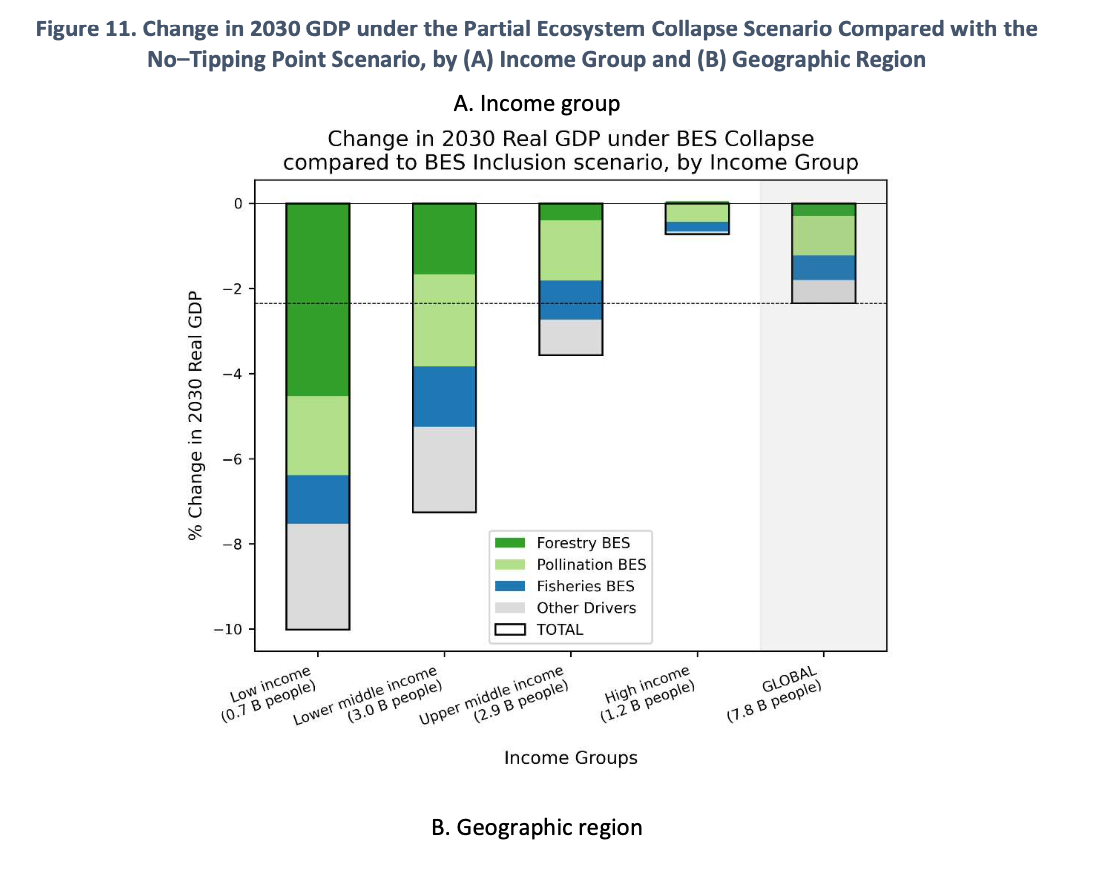
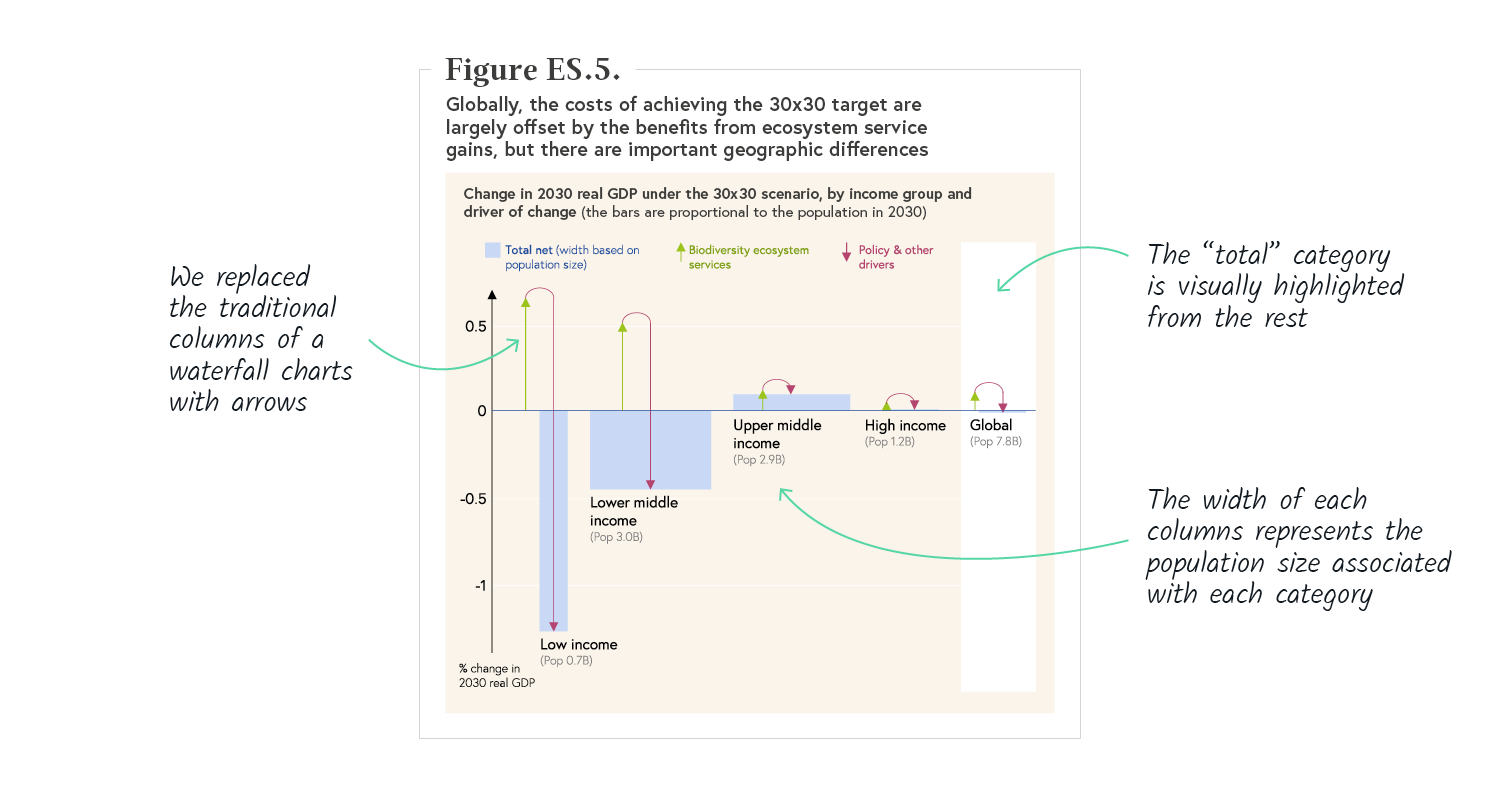
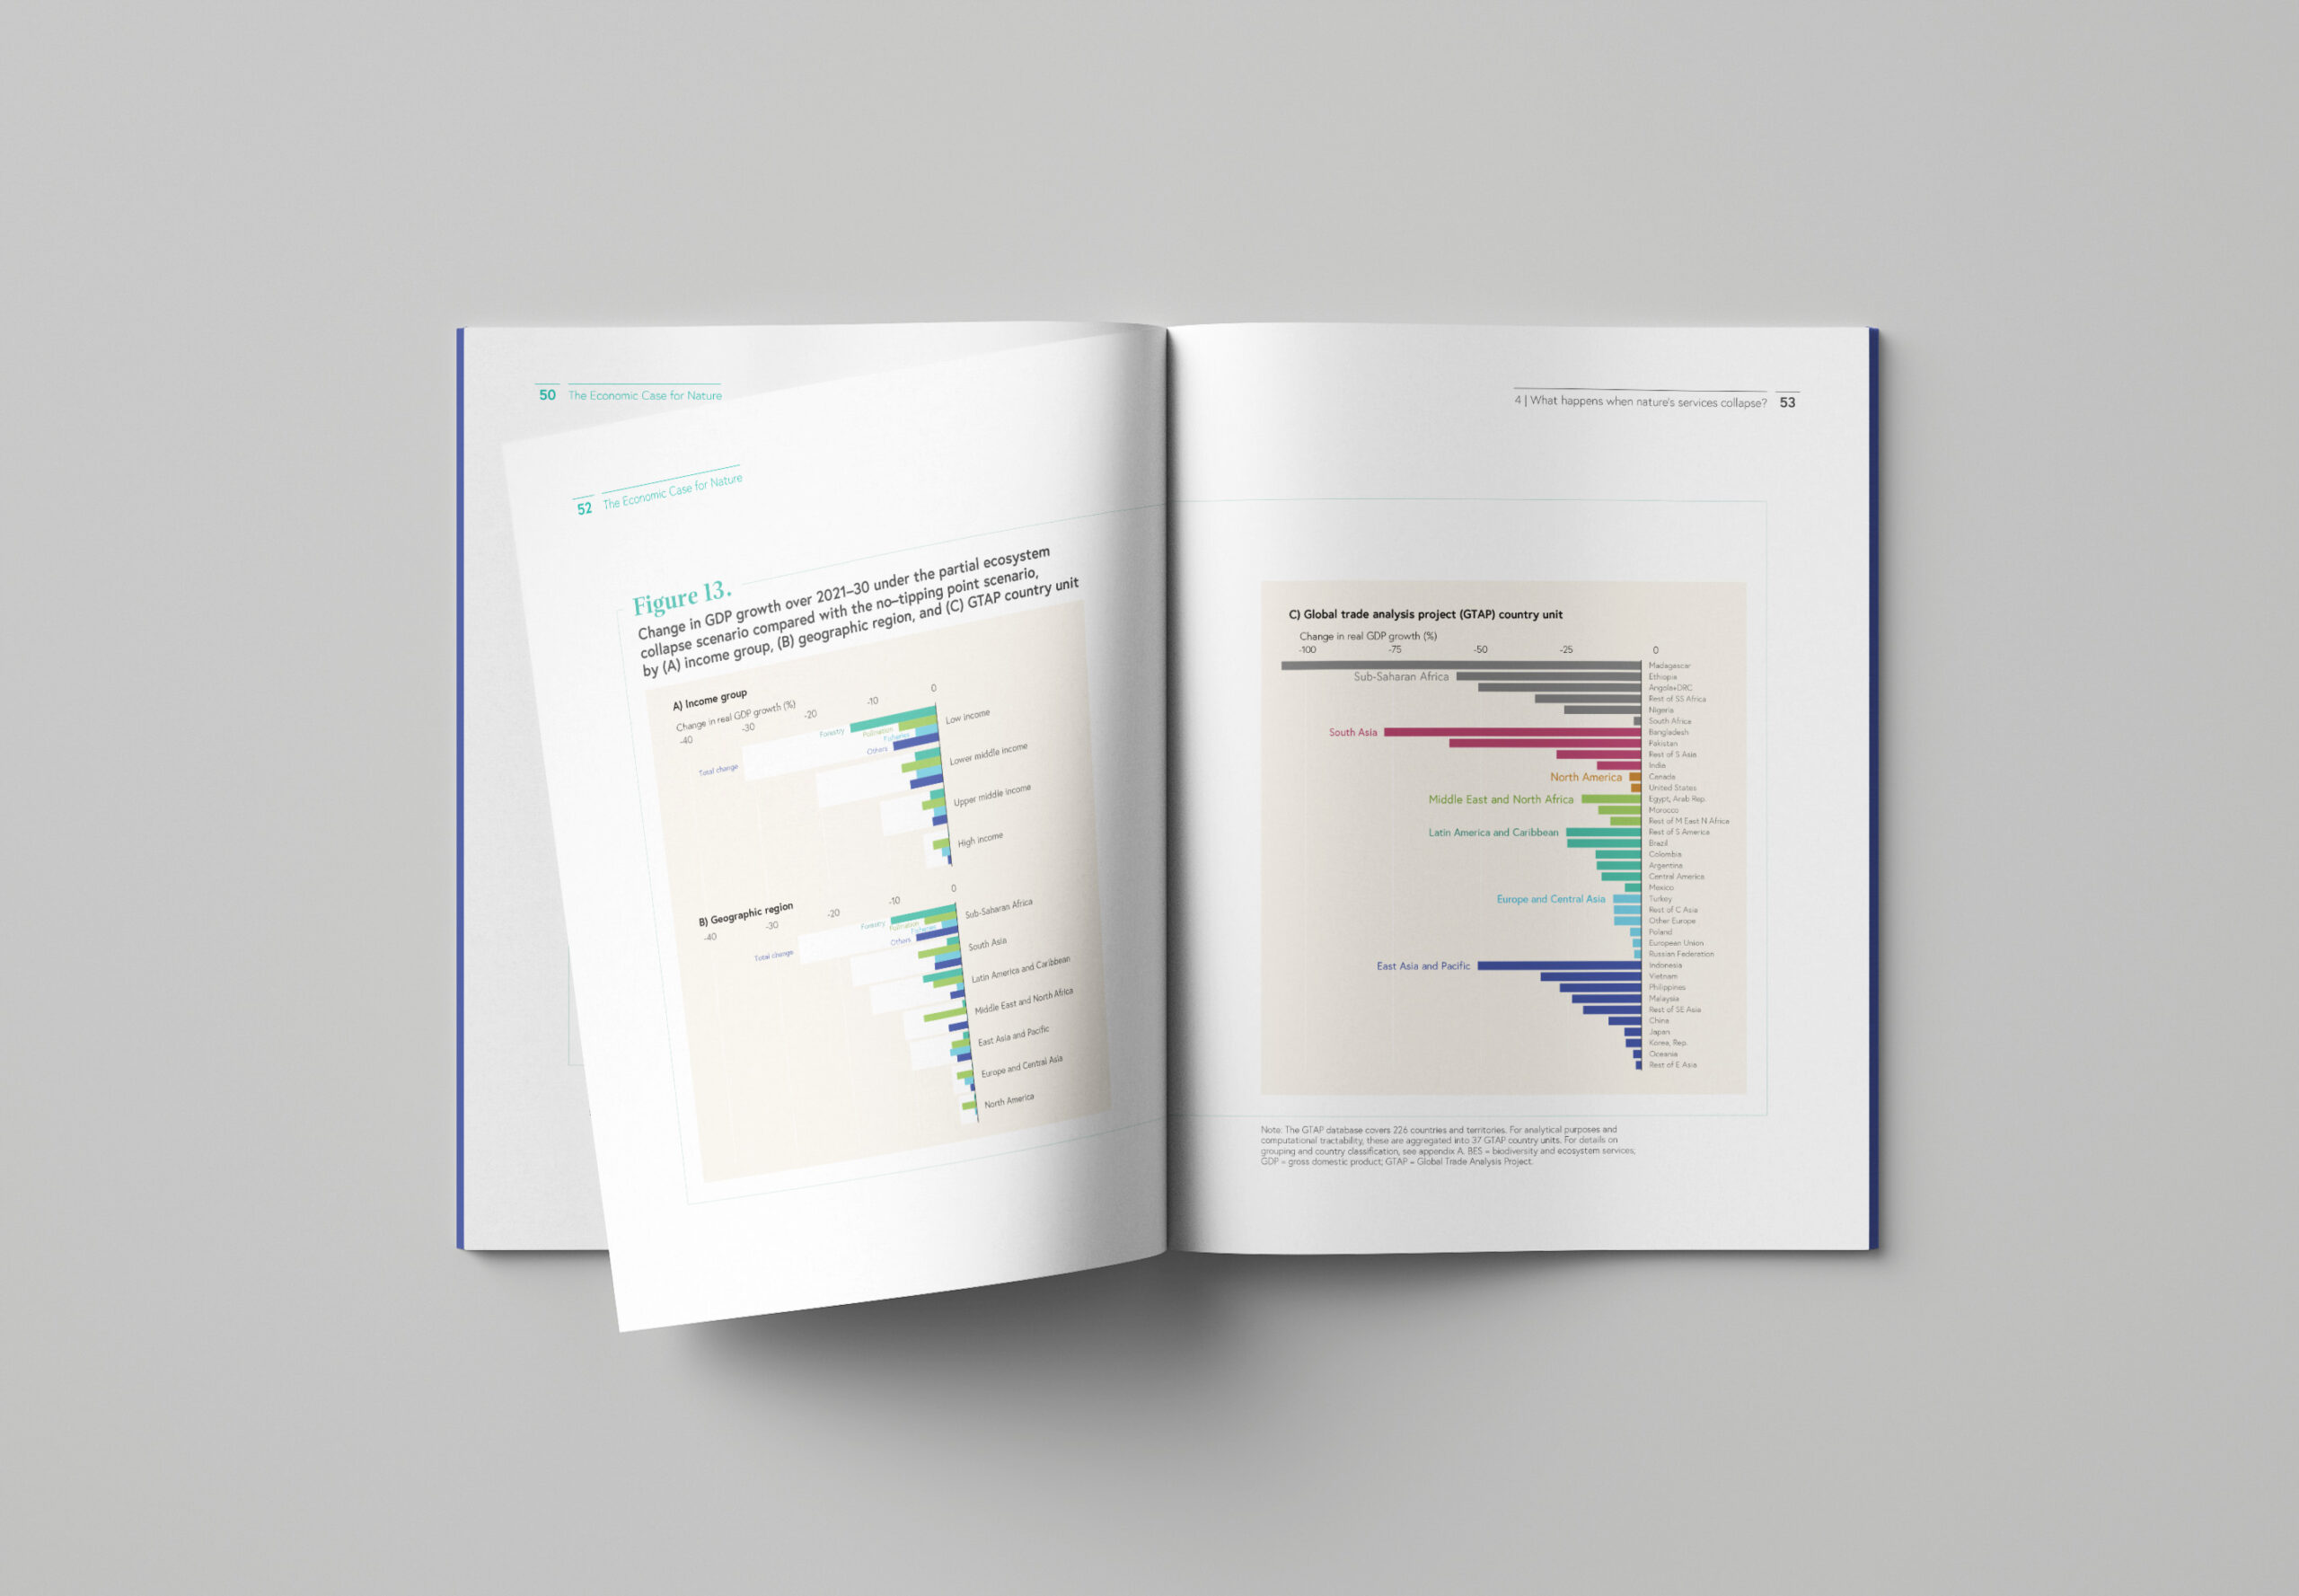
This chart highlights a piece of previously hidden information: the population size for each region. It gives a sense of scale, a connection to the human element. We can see the magnitude of the impact not only in terms of GDP change, but the number of people affected.
Before
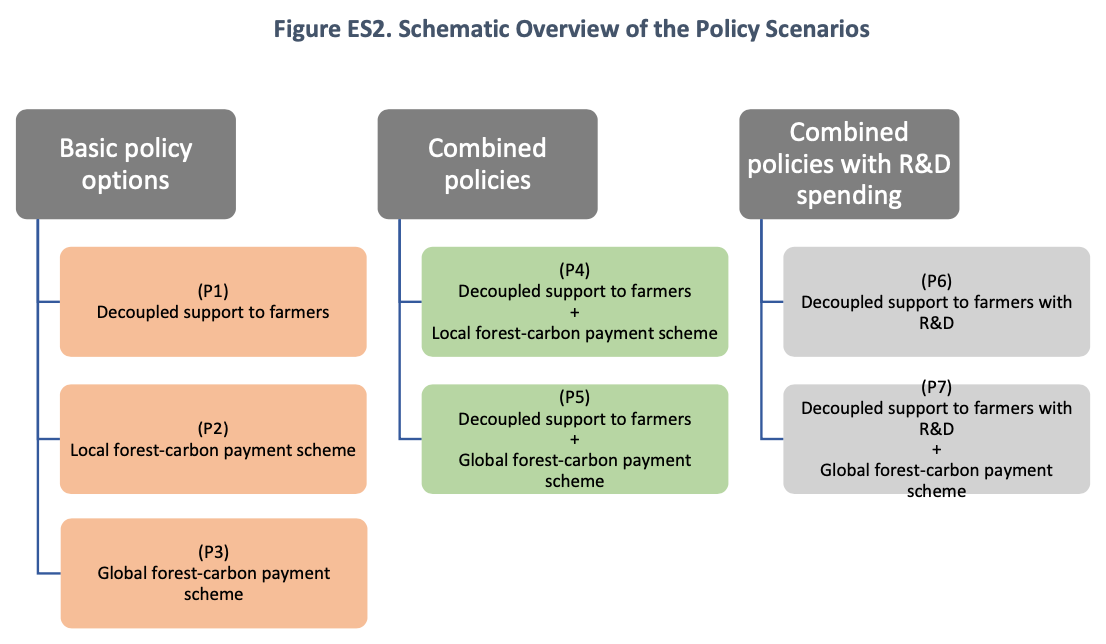
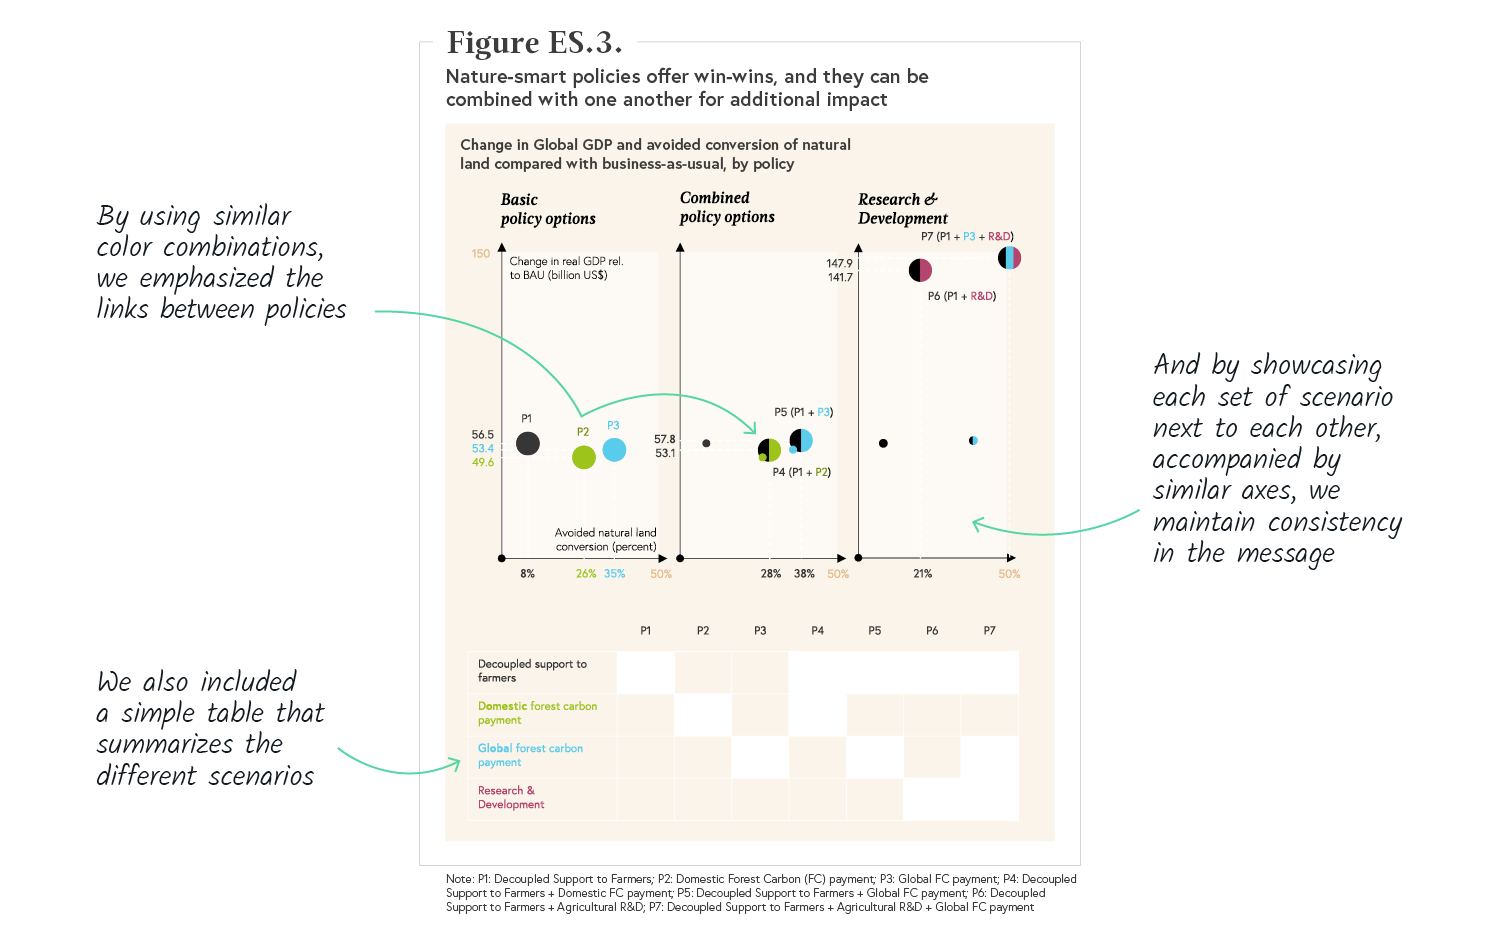
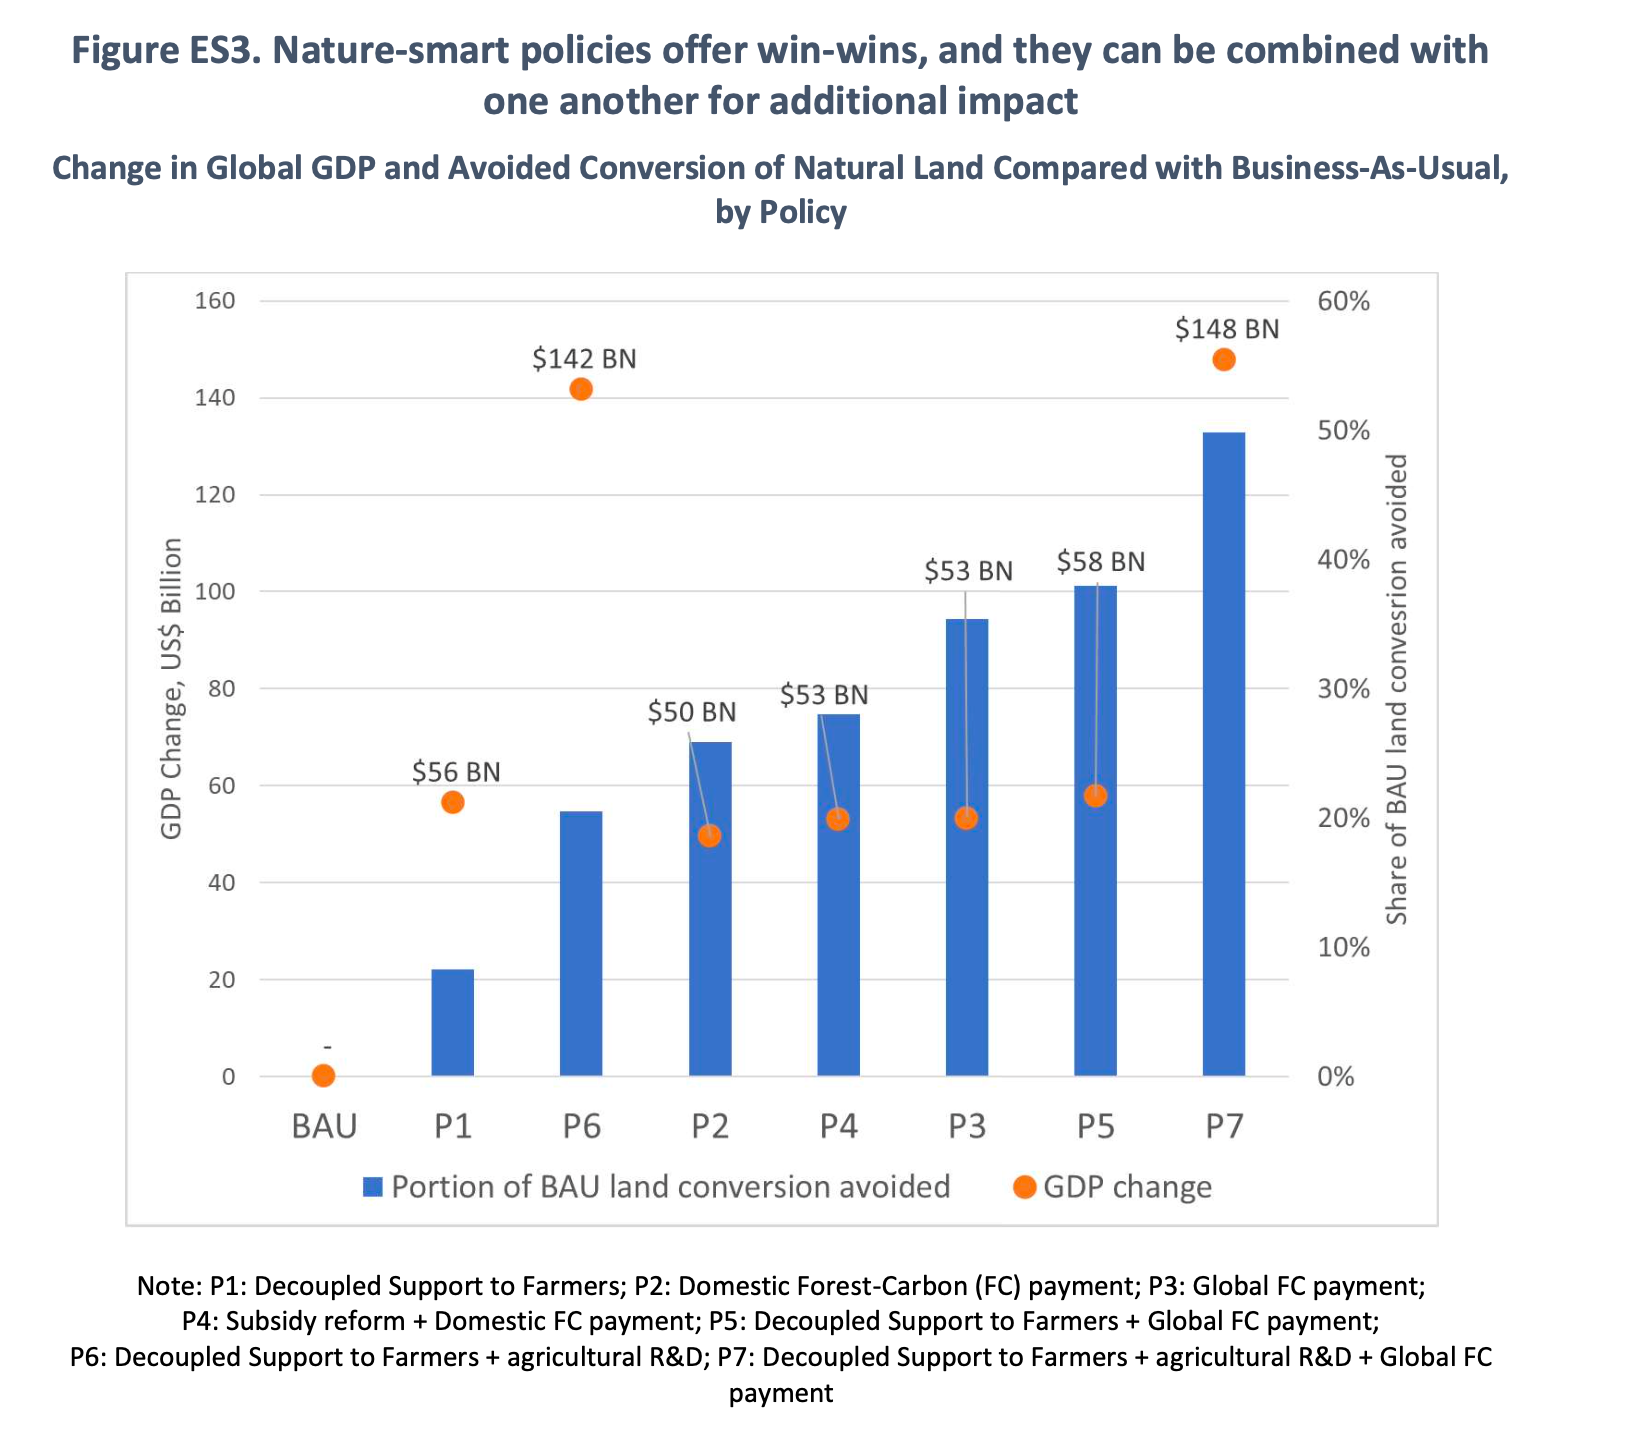
Exploring the effects of policies and how they can be combined
The World Bank also charted a way forward by exploring “nature-smart” policy options.
This scatterplot presents how those policy options will benefit us, both in terms of positive GDP change as well as avoid natural land loss. The challenge was to visually connect those policies together as they were often combinations of previous ones. We did this by using three colours for the basic policies, which are then re-used in the combined policy scenarios.
Before
Before
Finding the right balance to achieve our goals
Convincing the world to adopt the necessary policies is not an easy task. To make the argument, this chart shows how the economic loss caused by restrictions on land use (in red arrows in our visual) is almost entirely offset at the global level (white background) by the economic gains resulting from improved provisions of ecosystem services.
Before
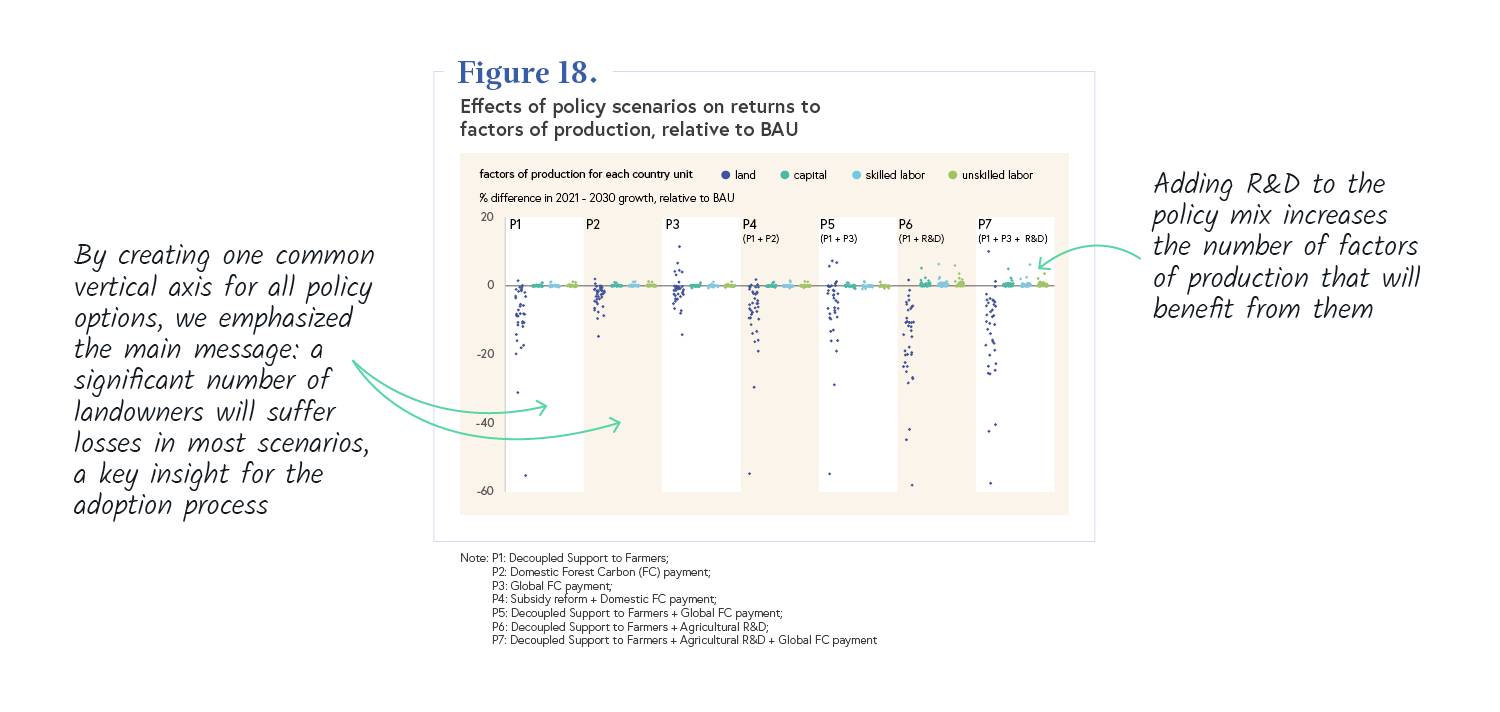
Who has the most to lose?
By reorganizing the way the data was presented in the initial visual, we were able to identify which groups had the most to lose from the implementation of each policy, a key information for the stakeholder engagement process. Moreover, with all policies displayed next to one another, we emphasize the clear benefits from investing in research and development (P6 and P7), as it increases the benefits for almost every group.
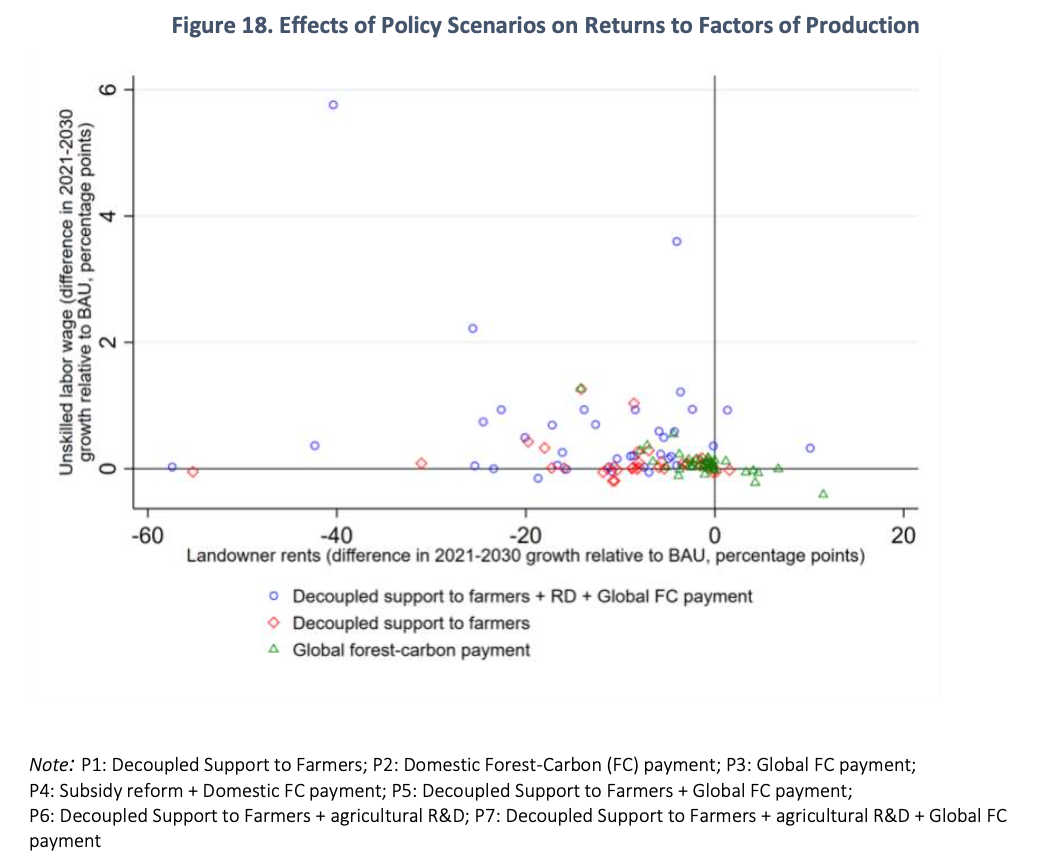
Before
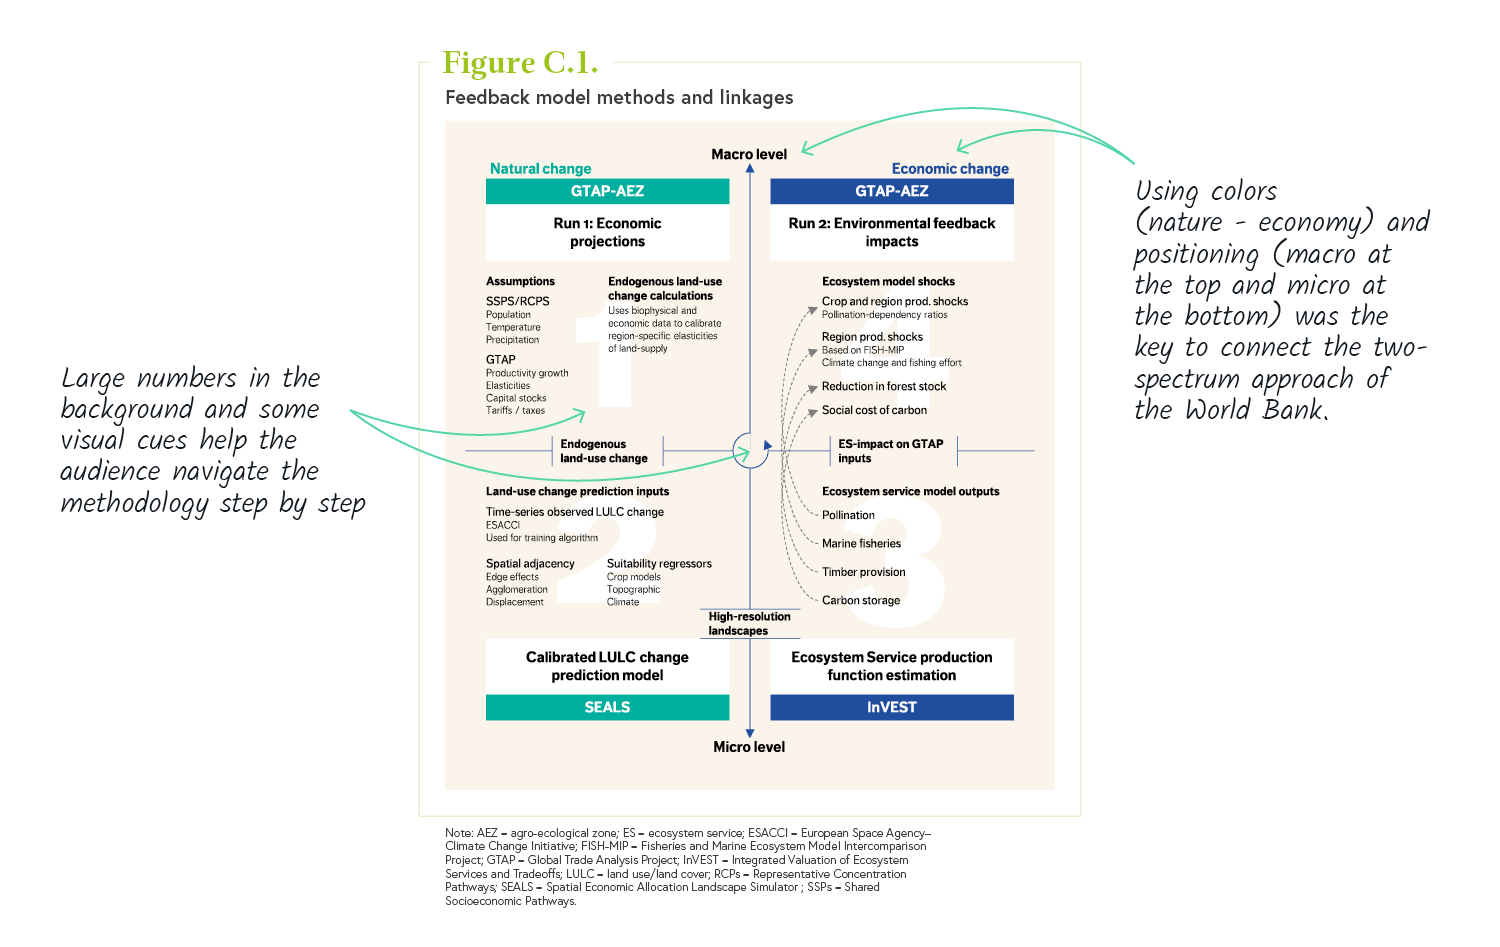
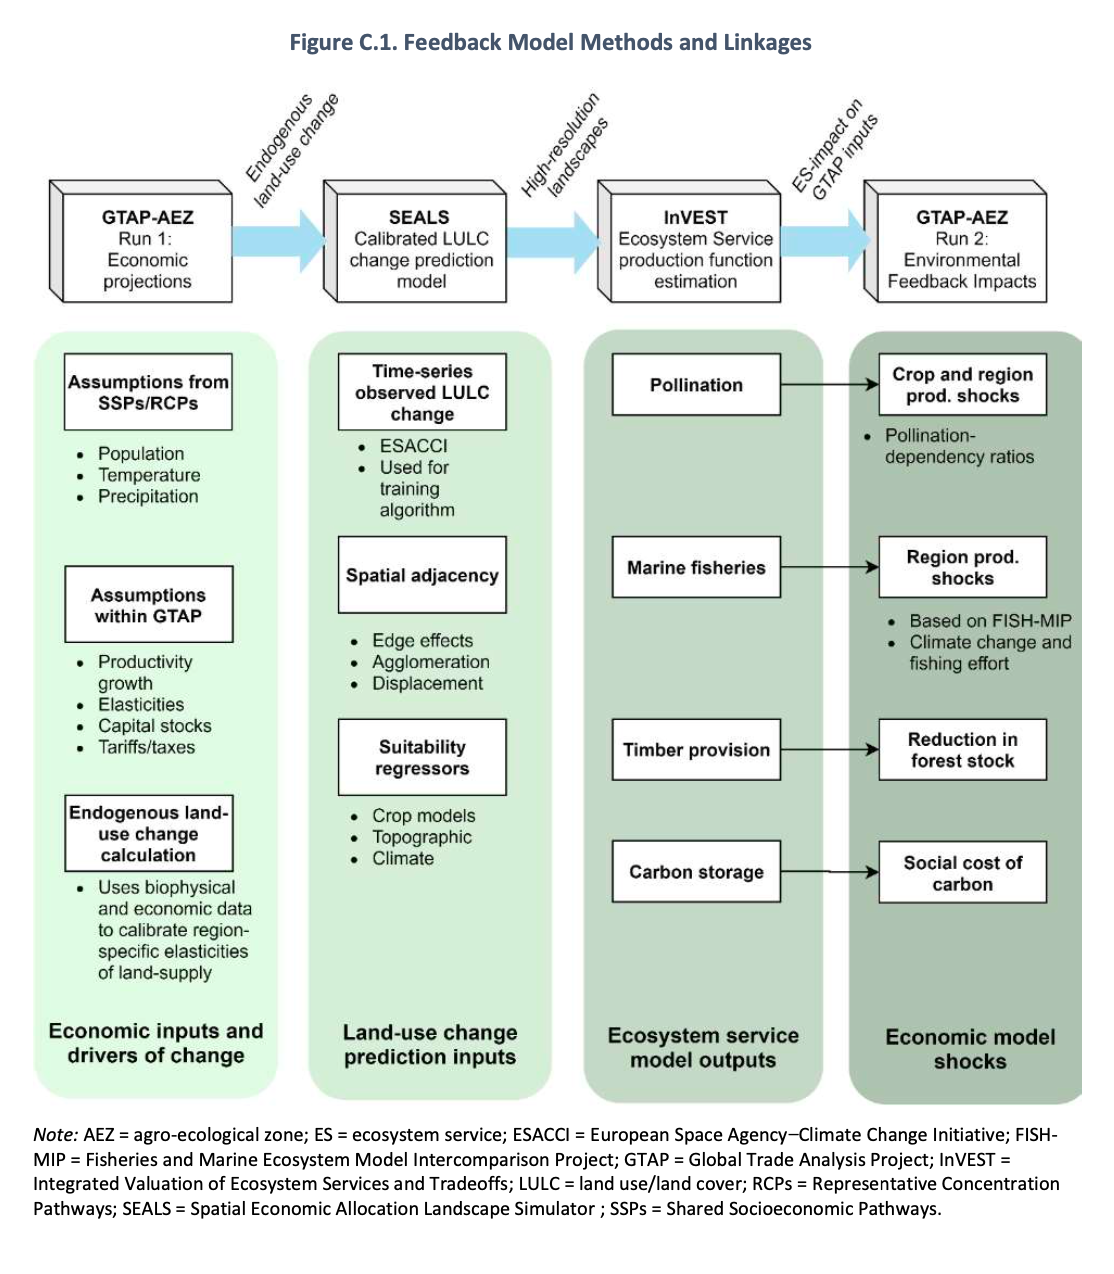
Accentuate the elegance of the methodology
As mentioned, the World Bank developed a first-of-its-kind methodology to conduct this research. By breaking down each step and mapping them on a 2×2 matrix, we emphasized the elegance with which the team was able to weave together macro- and micro-level analysis while navigating between the changes occurring in the natural world and the economic impacts that it will have on us.
Before
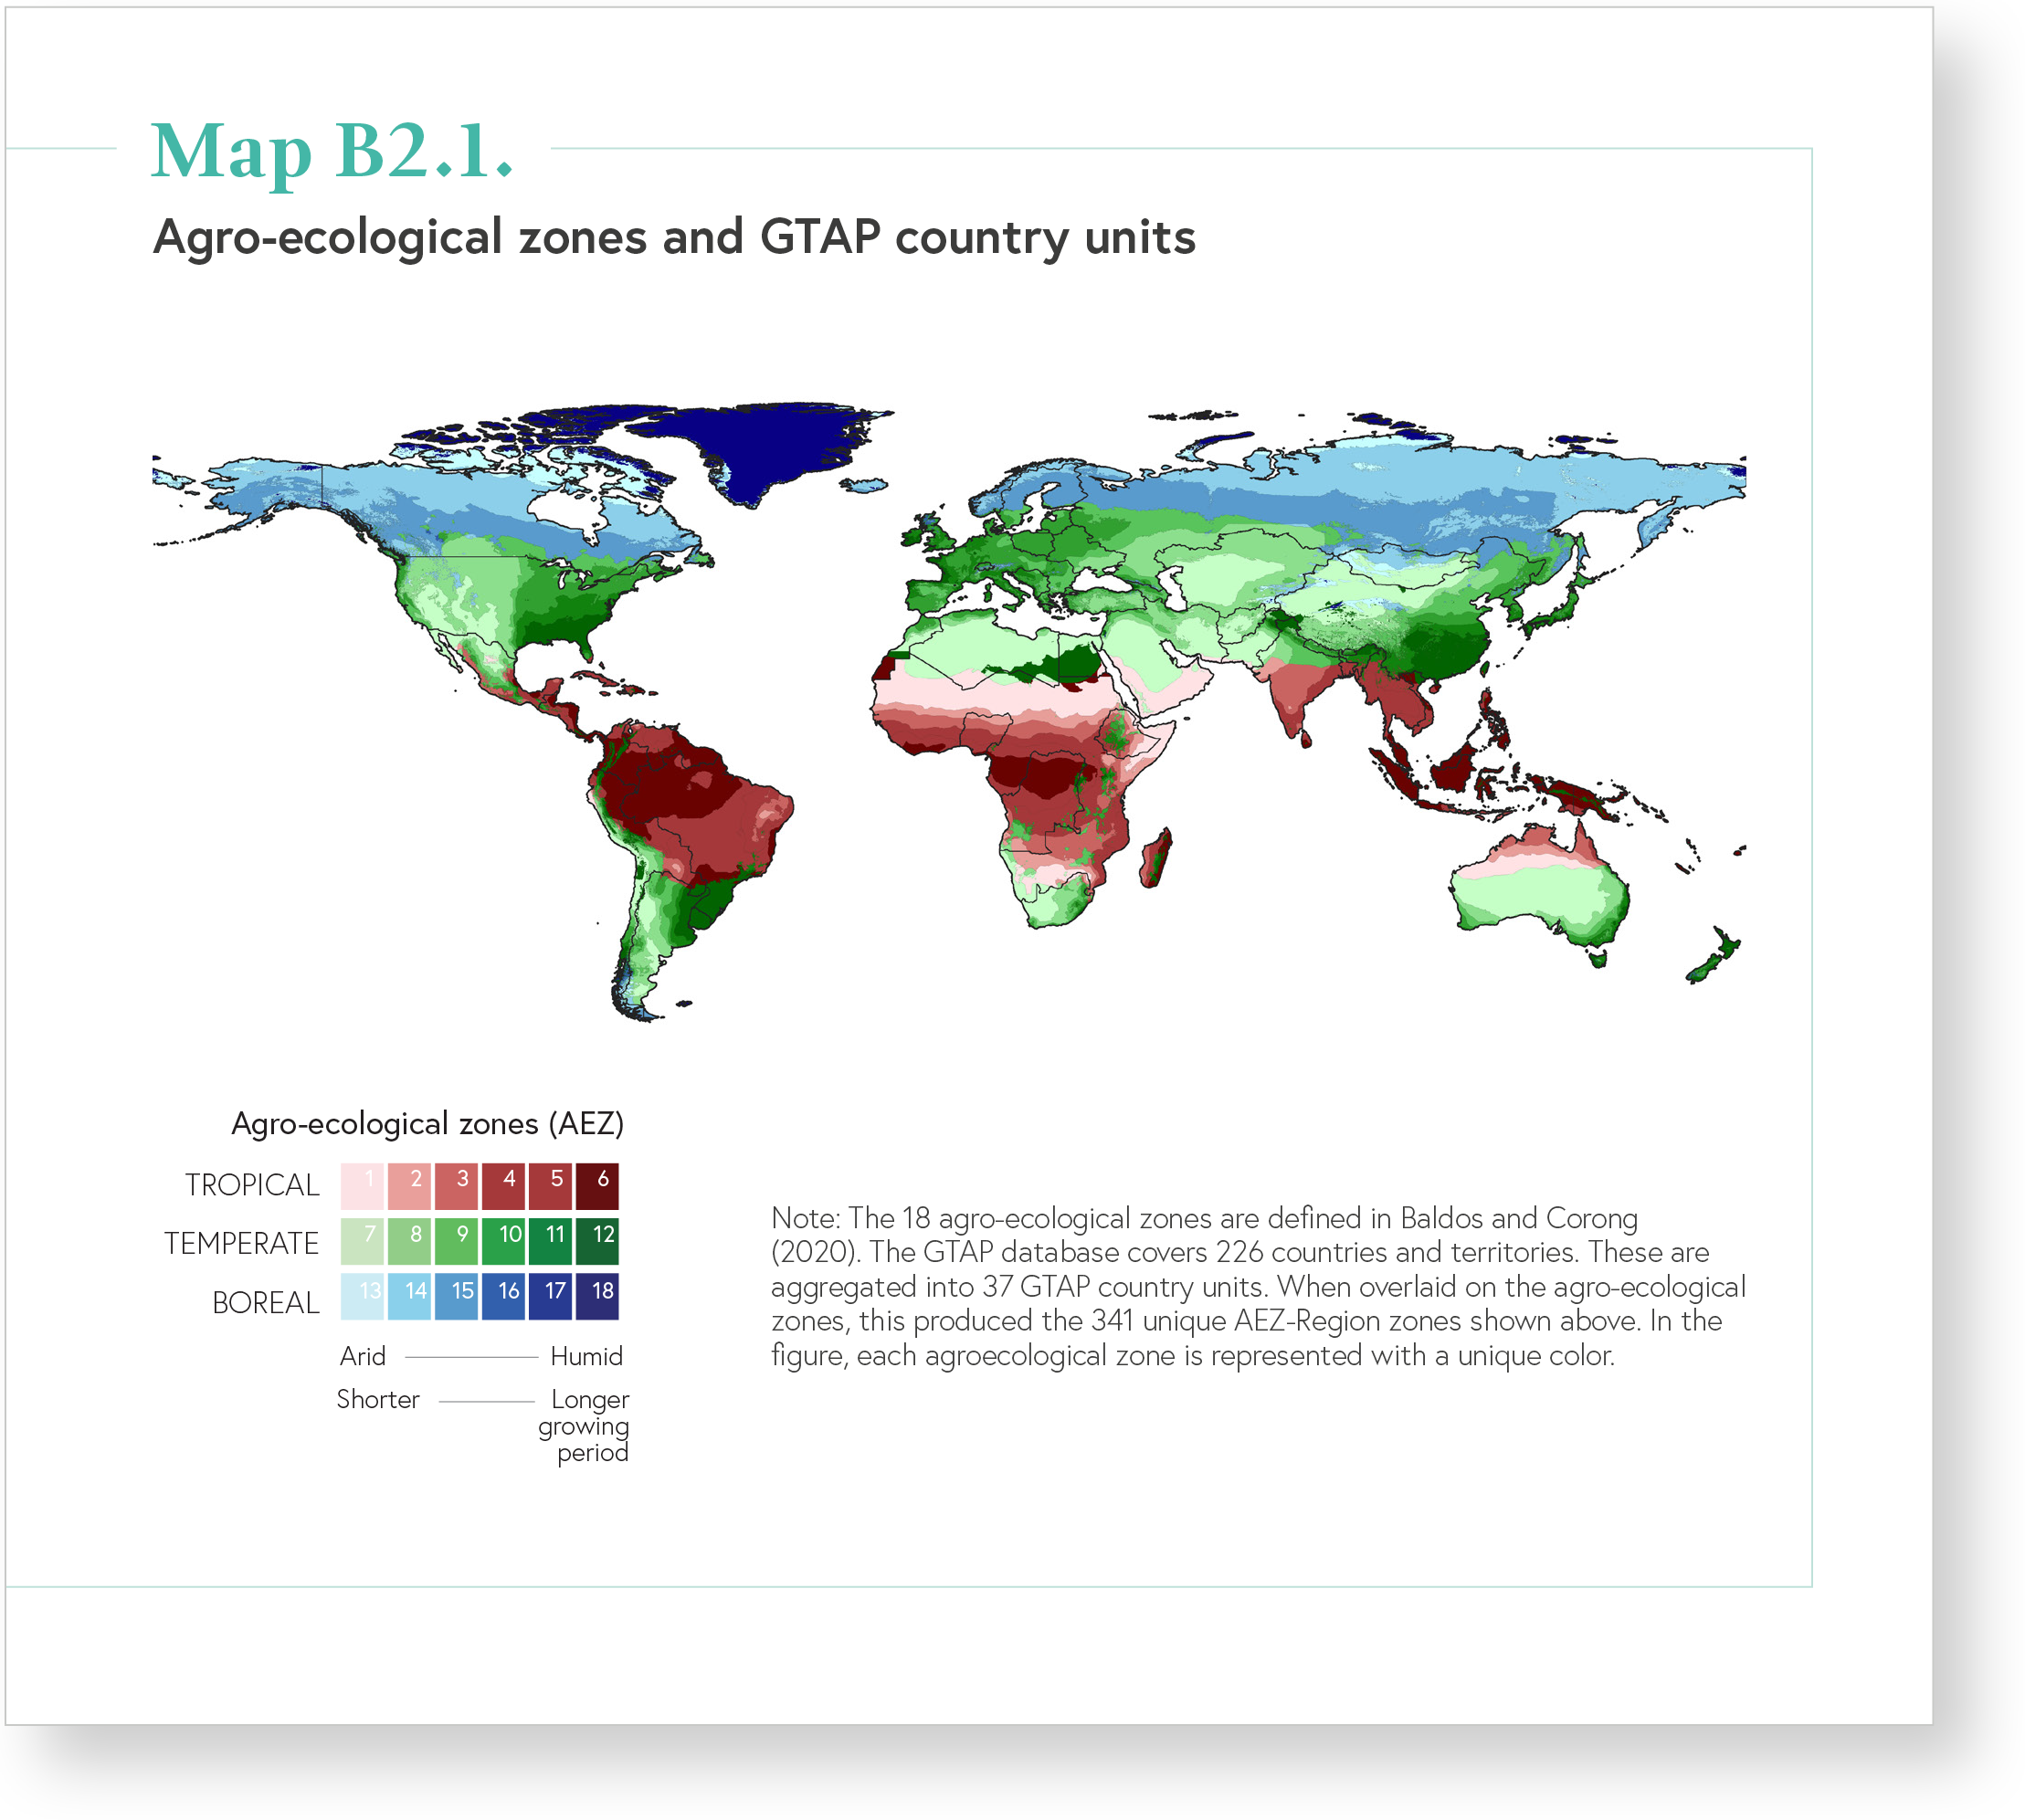
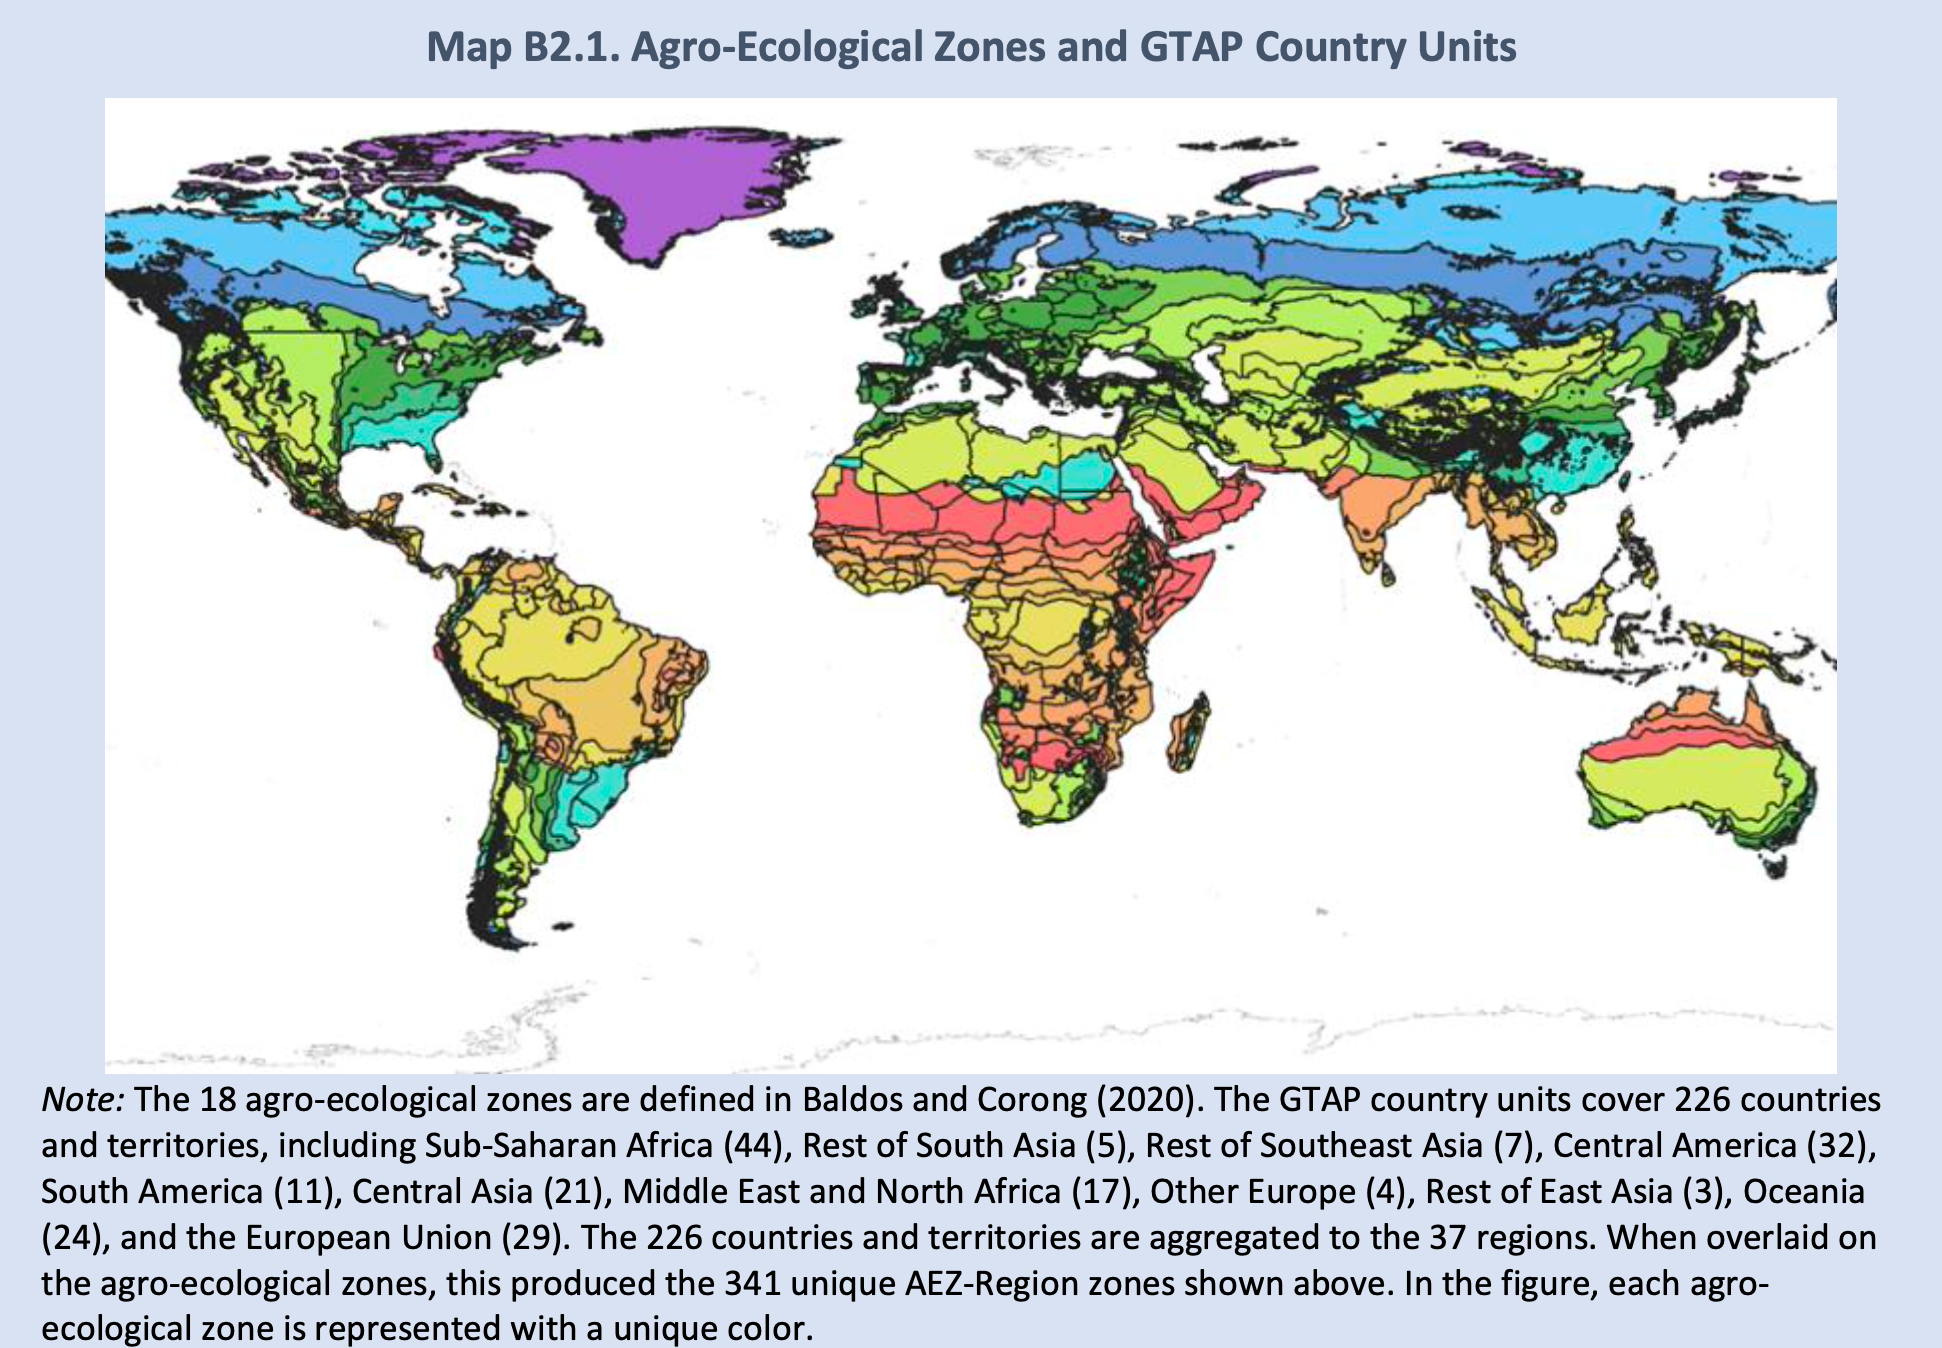
Adding meaning to the legend
For this map displaying agro-ecological zones, we changed the colours to reflect the organization of the different zones. We then designed the legend in a grid that captures the nature of the zones in terms of their environment, humidity and growing period.
The reader can now quickly grasp how each zone relates to another. Additionally, even when the reader may not be able to distinguish between two similar colours, the added information below the grid lets them understand a zone’s environmental characteristics.