
A new look at the performance of residential and long-term care centres in Québec
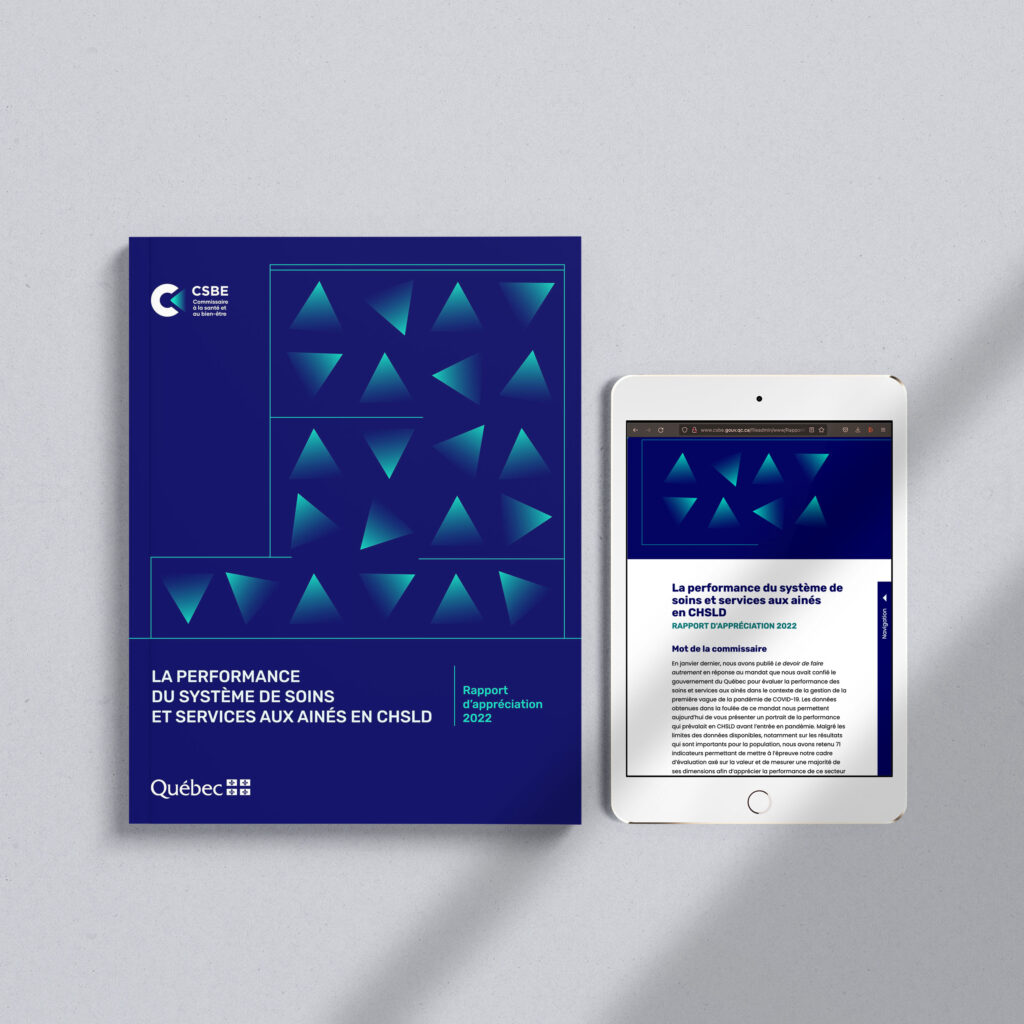
A new look at the performance of residential and long-term care centres in Québec The CSBE had a new method for evaluating the performance of long-term care facilities, which highlights major disparities across the territory. We accompanied them in the presentation of their study results, which highlighted numerous points for improvement in order to reach […]
Achieving net zero in Canada will require a Big Switch
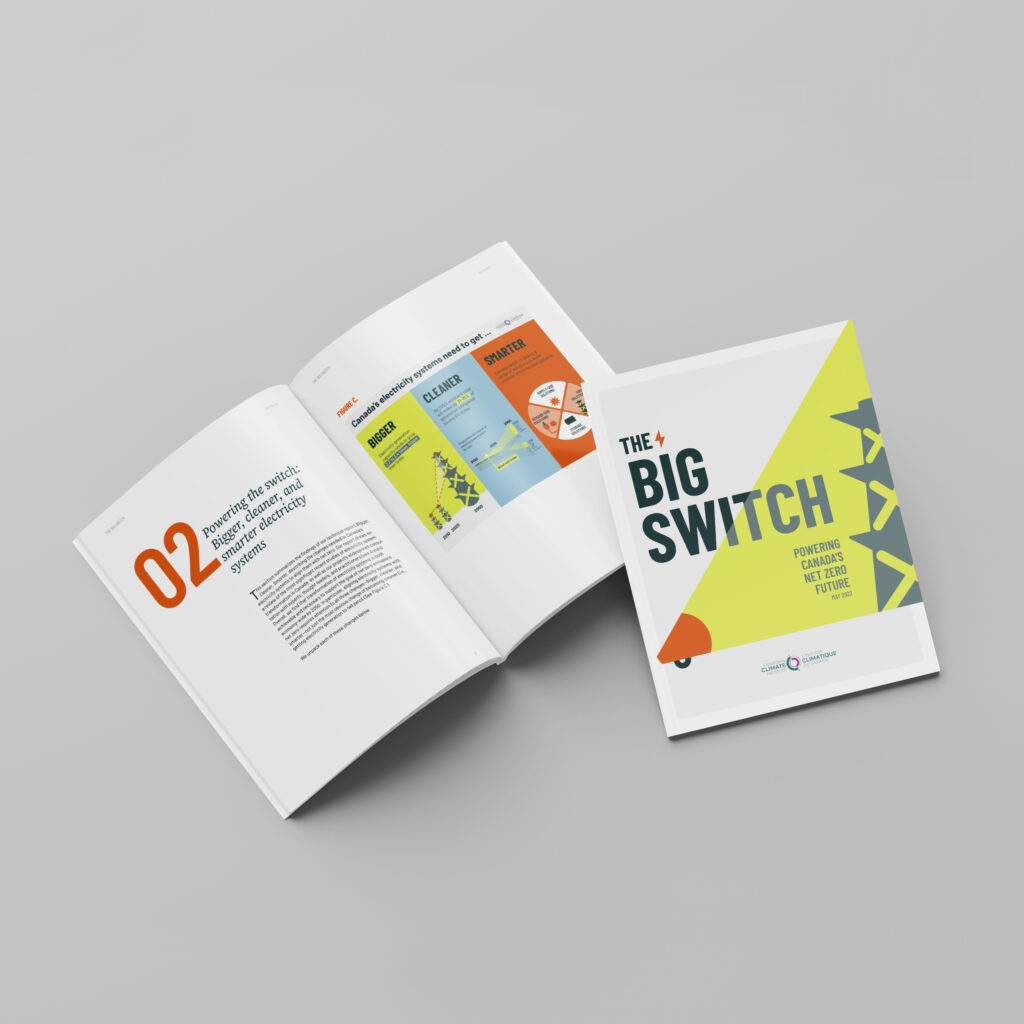
Achieving net zero in Canada will require a Big Switch In its new report, the Canadian Climate Institute lays the groundwork for a new electricity policy, exploring “the changes needed in Canada’s electricity systems to align them with net zero”. The challenge for Voilà: was to create compelling visuals that illustrate both the Institute’s message […]
The star of our work
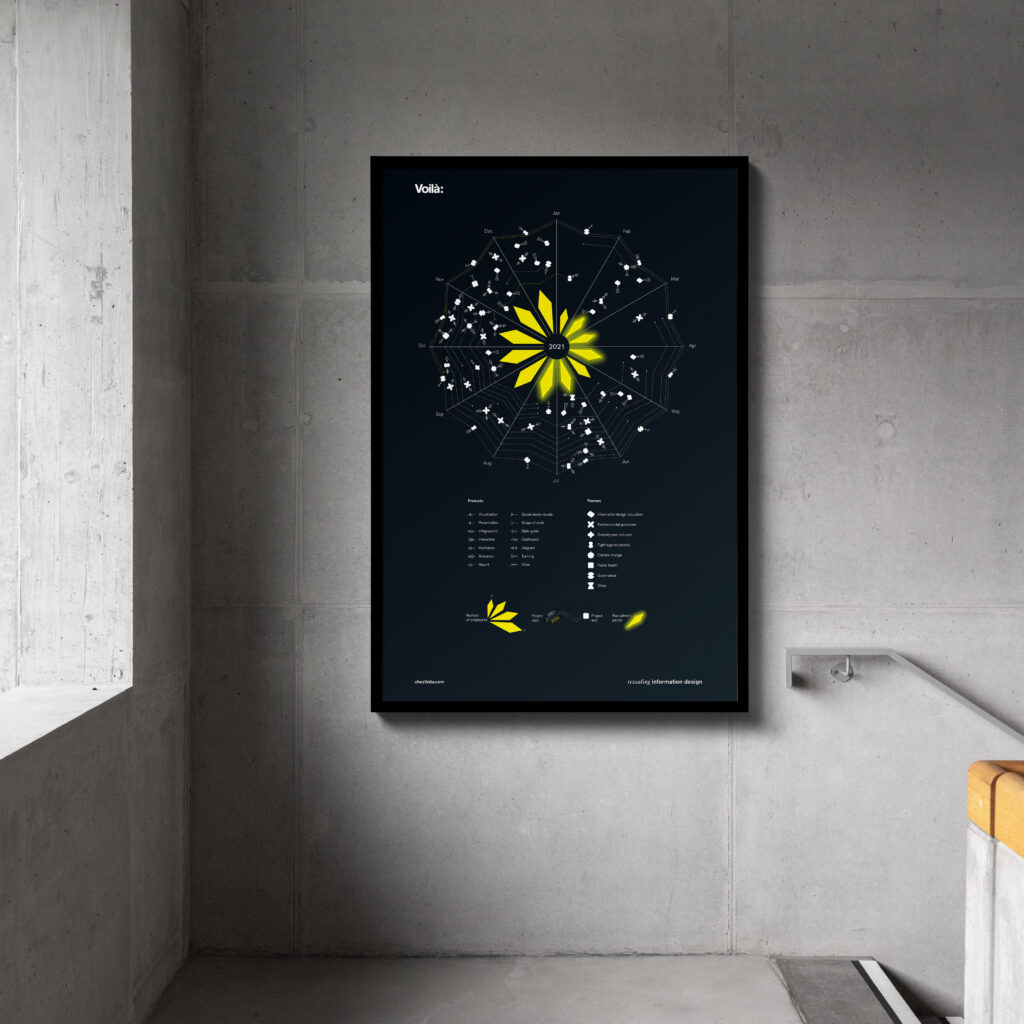
The star of our work 2021 was an exciting year at Voilà:, full of new projects and a growing team. Although we live and breathe information design, this was the first time we made a data visualization about ourselves. It was developed as a greeting card for clients, partners, collaborators and friends. While we are […]
The Canadian economy and the transition to a low-carbon world
The Canadian economy and the transition to a low-carbon world This report by the Canadian Institute for Climate Choices presents the opportunities for the Canadian economy to actively participate in building a low-carbon world. We supported them in presenting their findings and recommendations with clear and attractive visuals, developing the artistic direction, the concepts and […]
Standards for climate charts
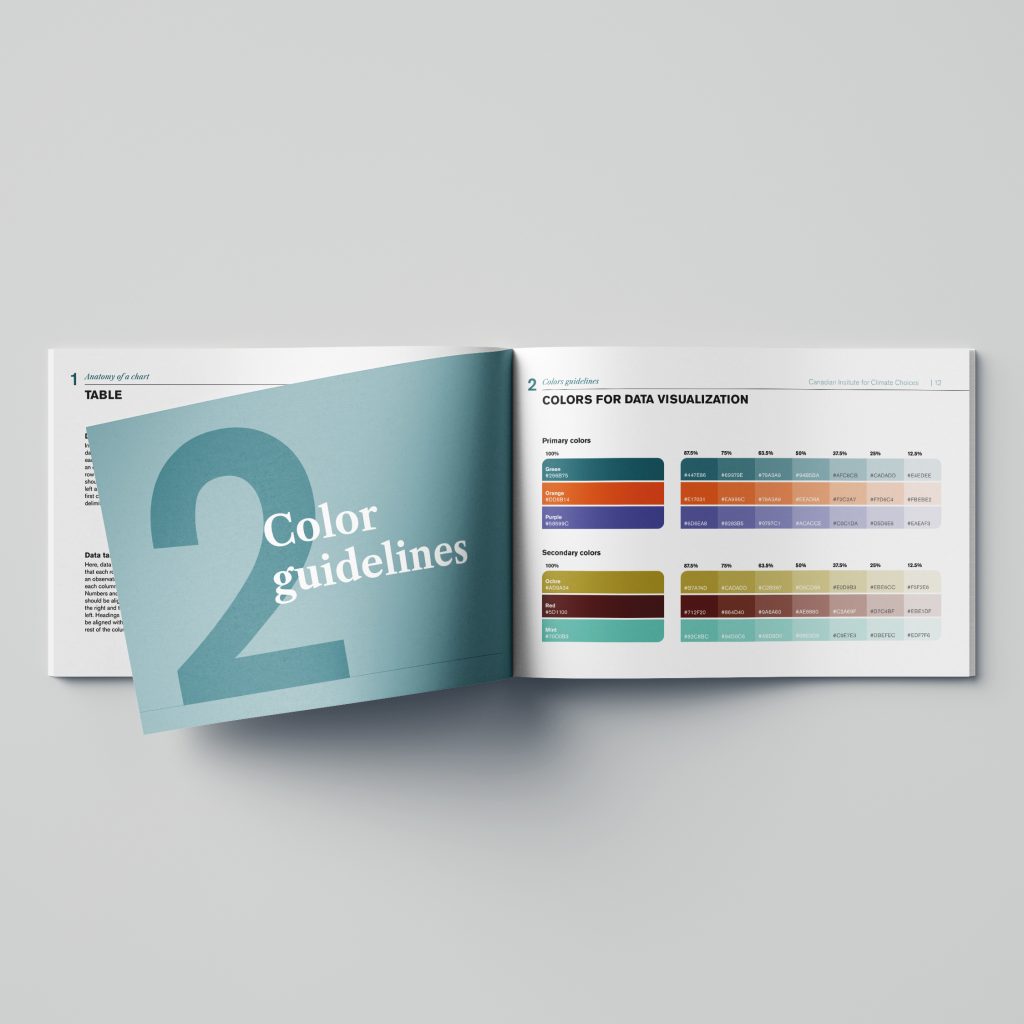
Setting standards for climate charts The Canadian Climate Institute approached Voilà: for a data visualization style guide with two broad objectives in mind. Firstly, ensuring that, externally, all communication materials are clear and effective. Secondly, raising awareness, internally, around data viz best practices and spreading this knowledge among internal stakeholders. As a result, we produced […]
Taking nature into account(ing)
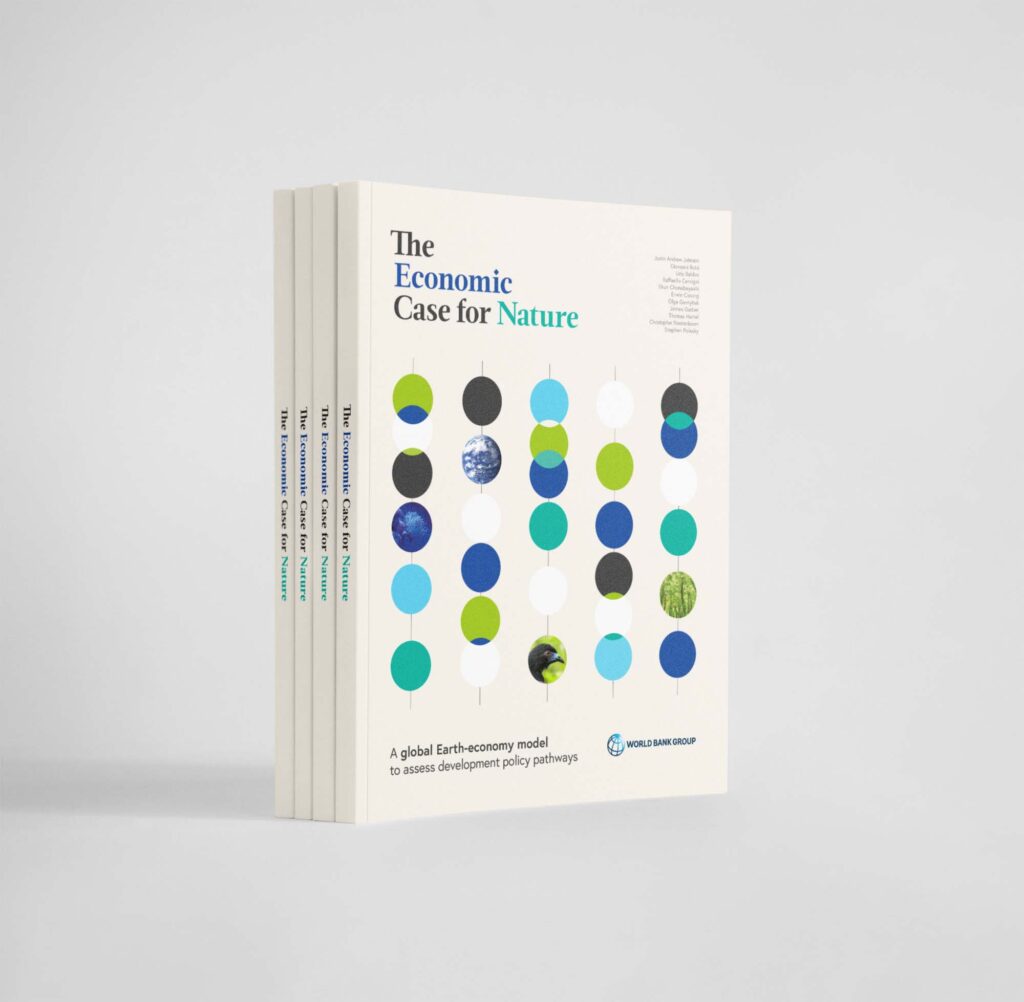
Taking nature into account(ing) The World Bank has developed a first-of-its-kind methodology to account for the value of nature in economic models. We worked with them to showcase the connection between biodiversity and economic development, the economic impacts of a collapse of ecosystems, and “nature-smart” policies that provide the best way forward. Making the (visual) […]
Networks at work

Networks at work The Tokyo Development Learning Center called on Voilà: to communicate clearly its comparison of Tokyo’s start-up ecosystem to similar innovation hubs around the world. Our challenge was to create intuitive visuals that presented this complex analysis of thousands of stakeholders and the relationships between them. Sleek layout with bright colors Given that […]
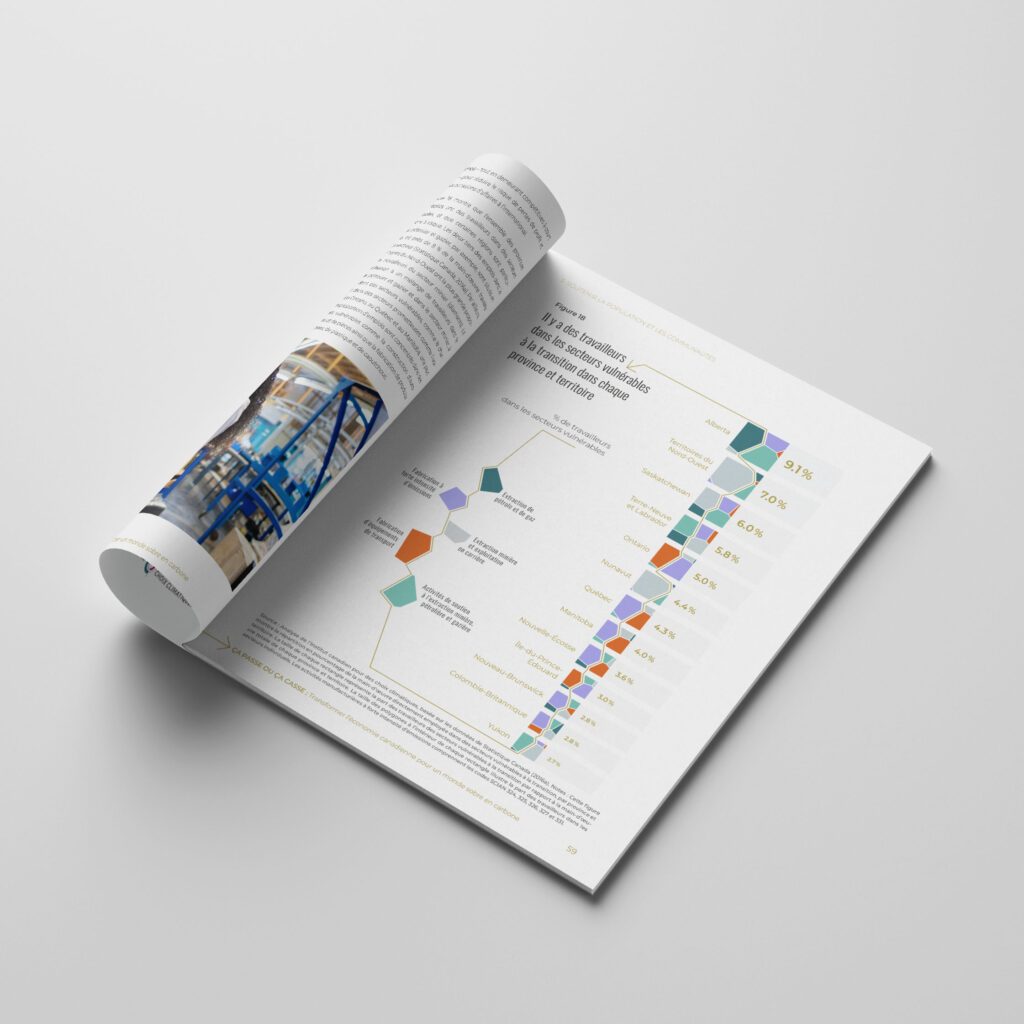
Finding the Canadian path to net zero greenhouse gas emissions
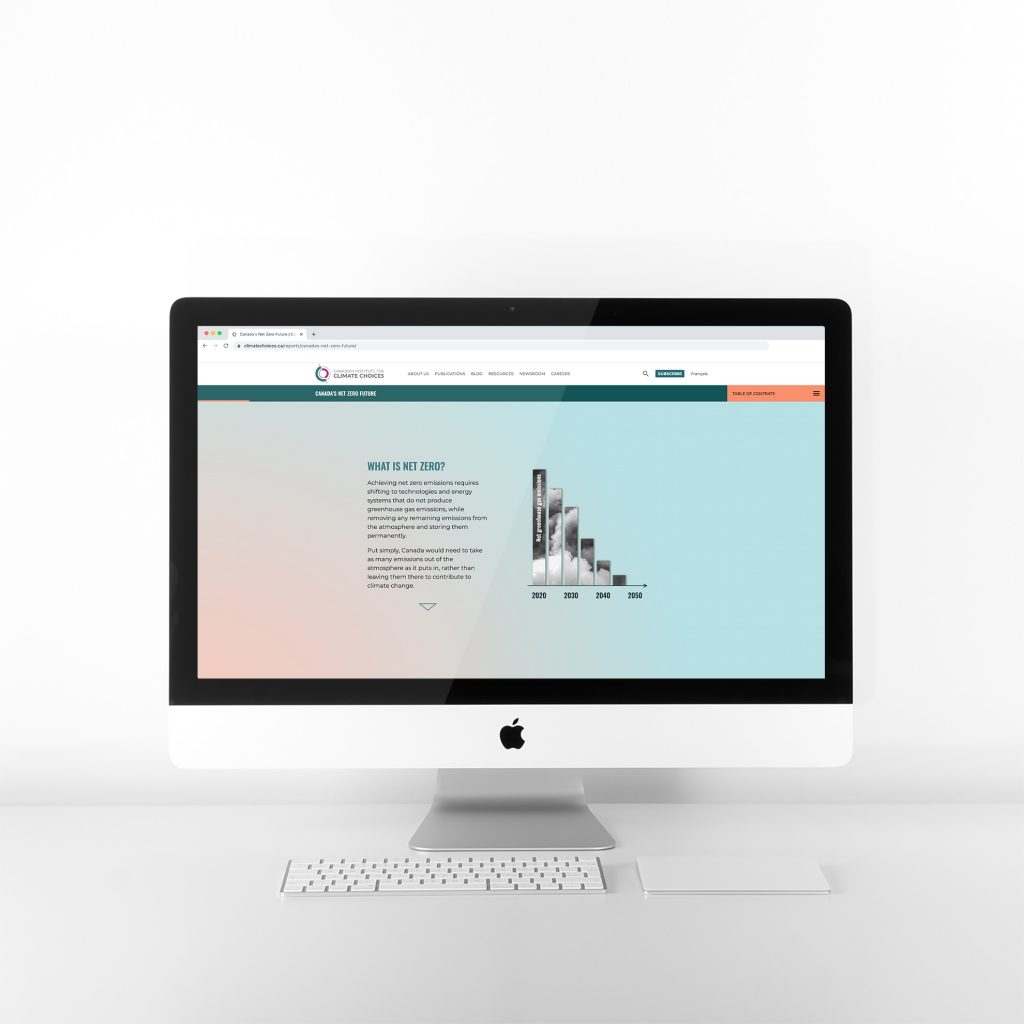
Finding the Canadian path to net zero greenhouse gas emissions The Canadian Institute for Climate Choices wrote a flagship report on the Canadian approach to the global quest to radically reduce carbon emissions to reduce climate change. They approached us to develop some punchy visuals that would clarify their findings and help give them wide […]
A portfolio of inclusive businesses for a sustainable future
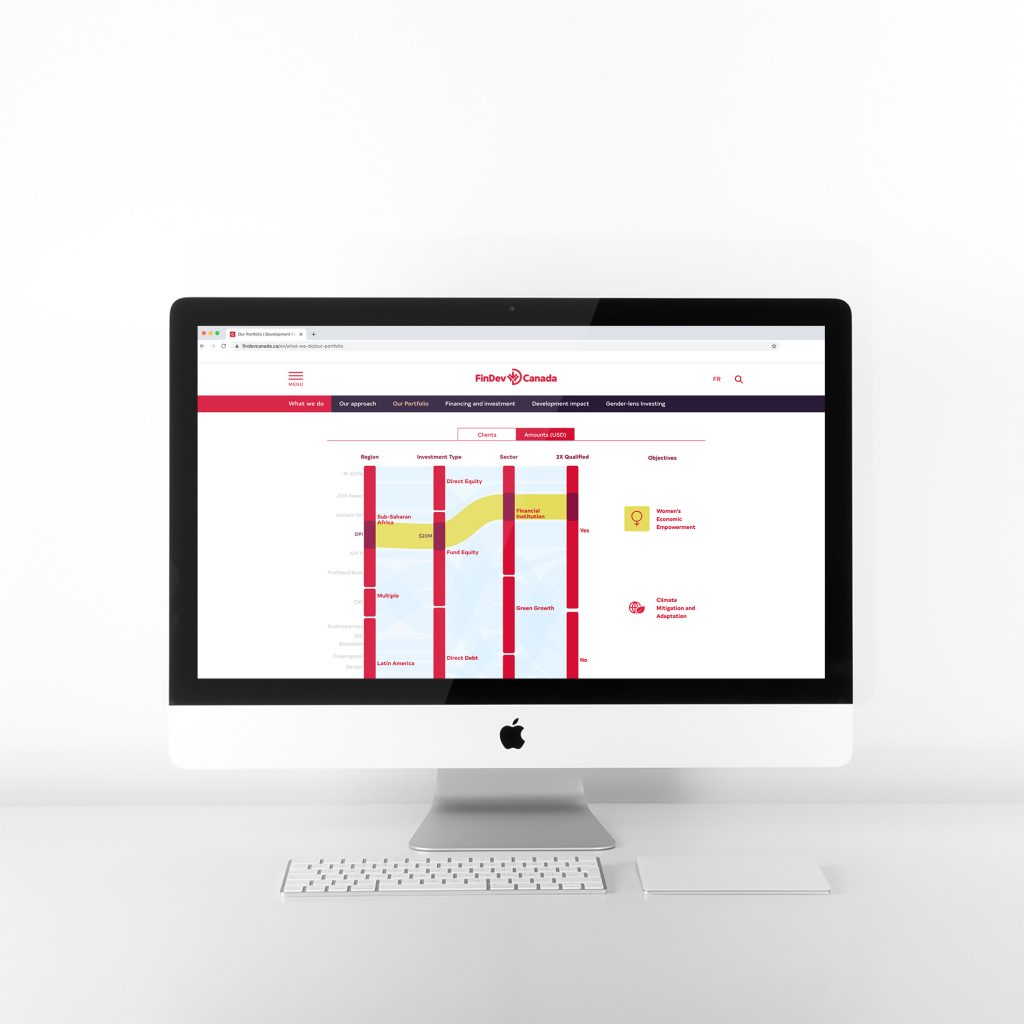
A portfolio of inclusive businesses for a sustainable future FinDev Canada opened in 2018 with the goal of supporting the growth and sustainability of businesses in developing markets. After only two years of operations, they were ready to present their portfolio of projects to the world. FinDev Canada therefore asked us to develop a visualization […]
Integration of new immigrants in Montréal
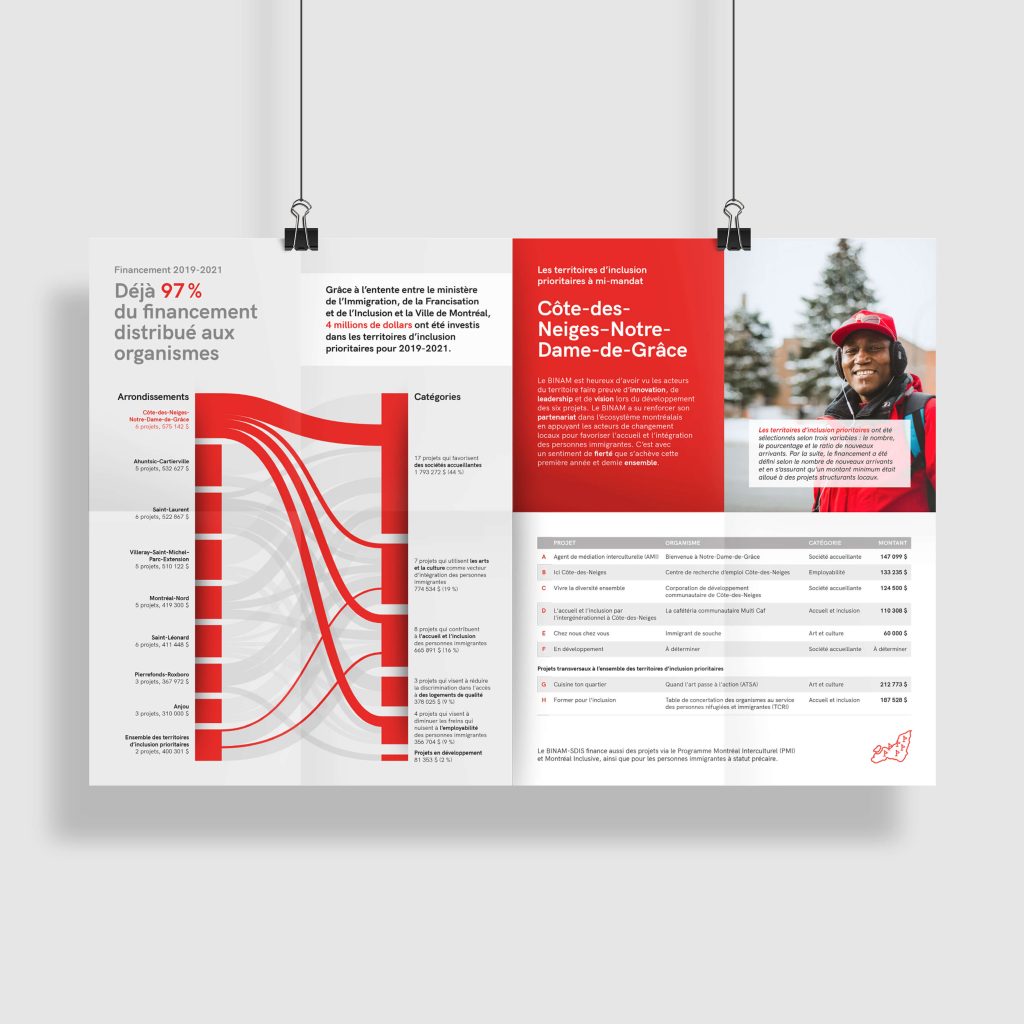
Integration of new immigrants in Montreal The Ville de Montréal has identified eight high priority regions for the inclusion of new immigrants (“territoires d’inclusion prioritaires”). After more than a year of distributing funding that facilitates the integration of immigrants, they wanted to inform their partners of the nature of the projects funded. The distribution of […]