As bad as 2021 was at the global level, it has been good to Voilà:.
As I reflect back, it is hard to believe how much we have progressed in just a year. There are many things that I take for granted now but did not exist a year ago. Every year, I believe that the growth rate cannot be sustained and yet, it is.
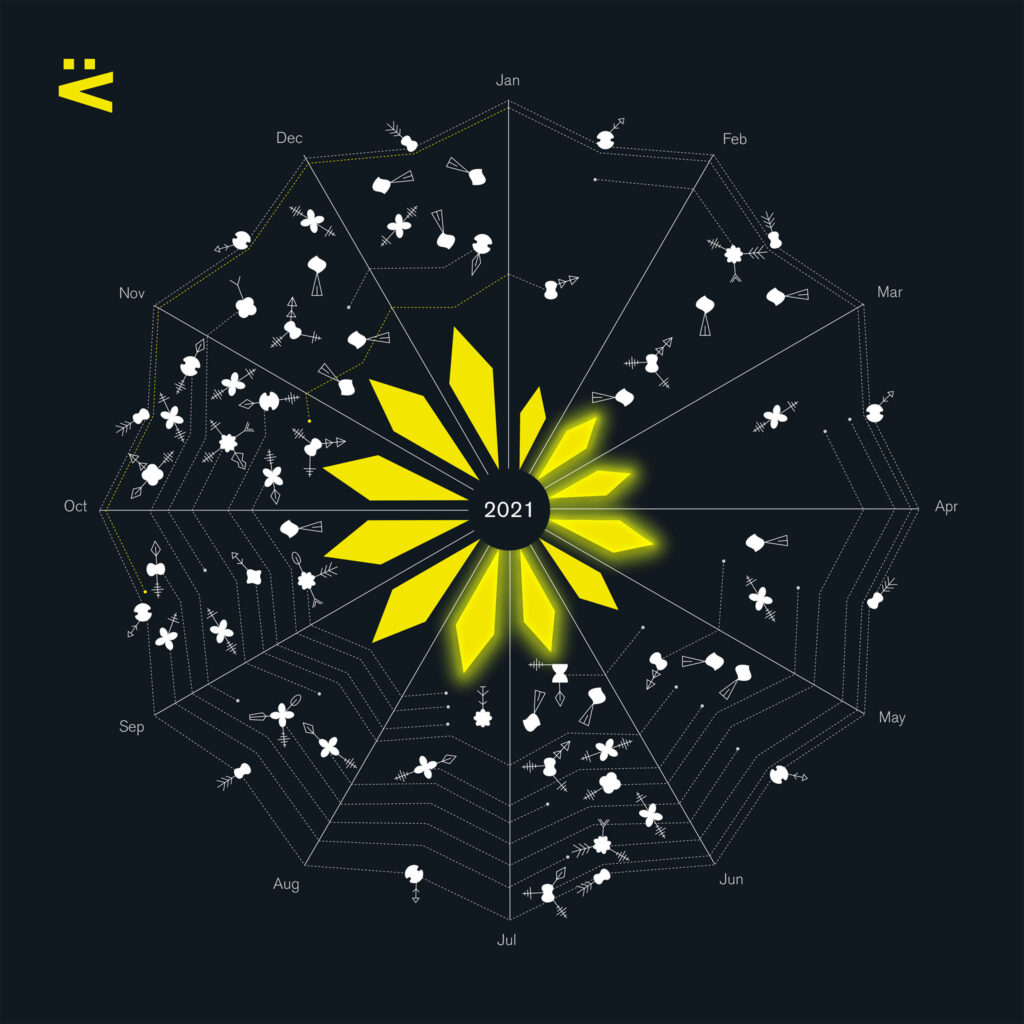
See also our visual overview of 2021
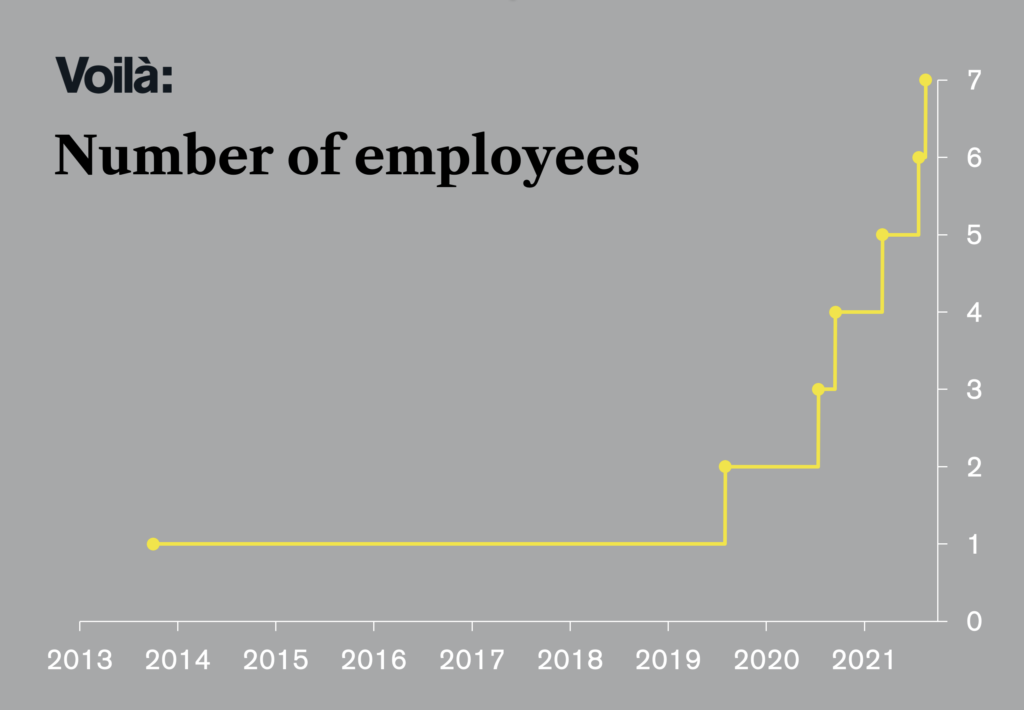
Team building
In a year, Voilà: went from four to seven people.
We hired a new developer and added an information designer and two more graphic designers. Four people hiring four people is a lot of work, and integrating new hires to the team can be a challenge, but apart from all the time that it took, it’s been a success and it feels to me like we’ve been together forever.
Each new hire changes the mood, but going from 5 to 7 turned the tables on me. To caricature, at first I felt that the team was serving me and now I’m serving the team. There is always something to set up or to review. I felt overwhelmed at first and I had to adapt, but now it feels exactly where I wanted to be. There are a lot of one-person businesses by choice in dataviz, but after five years of this, I was done. I wanted to do more and better than I do alone, and I couldn’t be happier to see it happening.
I like to talk about building a business around information design and if you want to hear more of my thoughts on the topic, I went on PolicyViz to discuss it with Jon Schwabish.
On the staffing side, we had our very first promotion as Chloé Cousin went from project coordinator to project manager, a reflection of her true contribution. We’ve also had our first resignation, when our developer Olivia was poached by Le Devoir, a daily newspaper in Québec investing in data visualization, so I even take a little pride in this.
We had the chance to work with talented collaborators, like Sophie Ouch, Marc Lajoie and Chris Viau. Each of them do outstanding work and I’m grateful that they agree to associate with us.
We’ve had such a good year that everybody got a bonus and a raise, and we even added a group insurance policy. This insurance is not a big deal like in the US (thankfully), but it covers disability insurance, life insurance and some health costs. We even had two people buying homes this year!
An interactive year
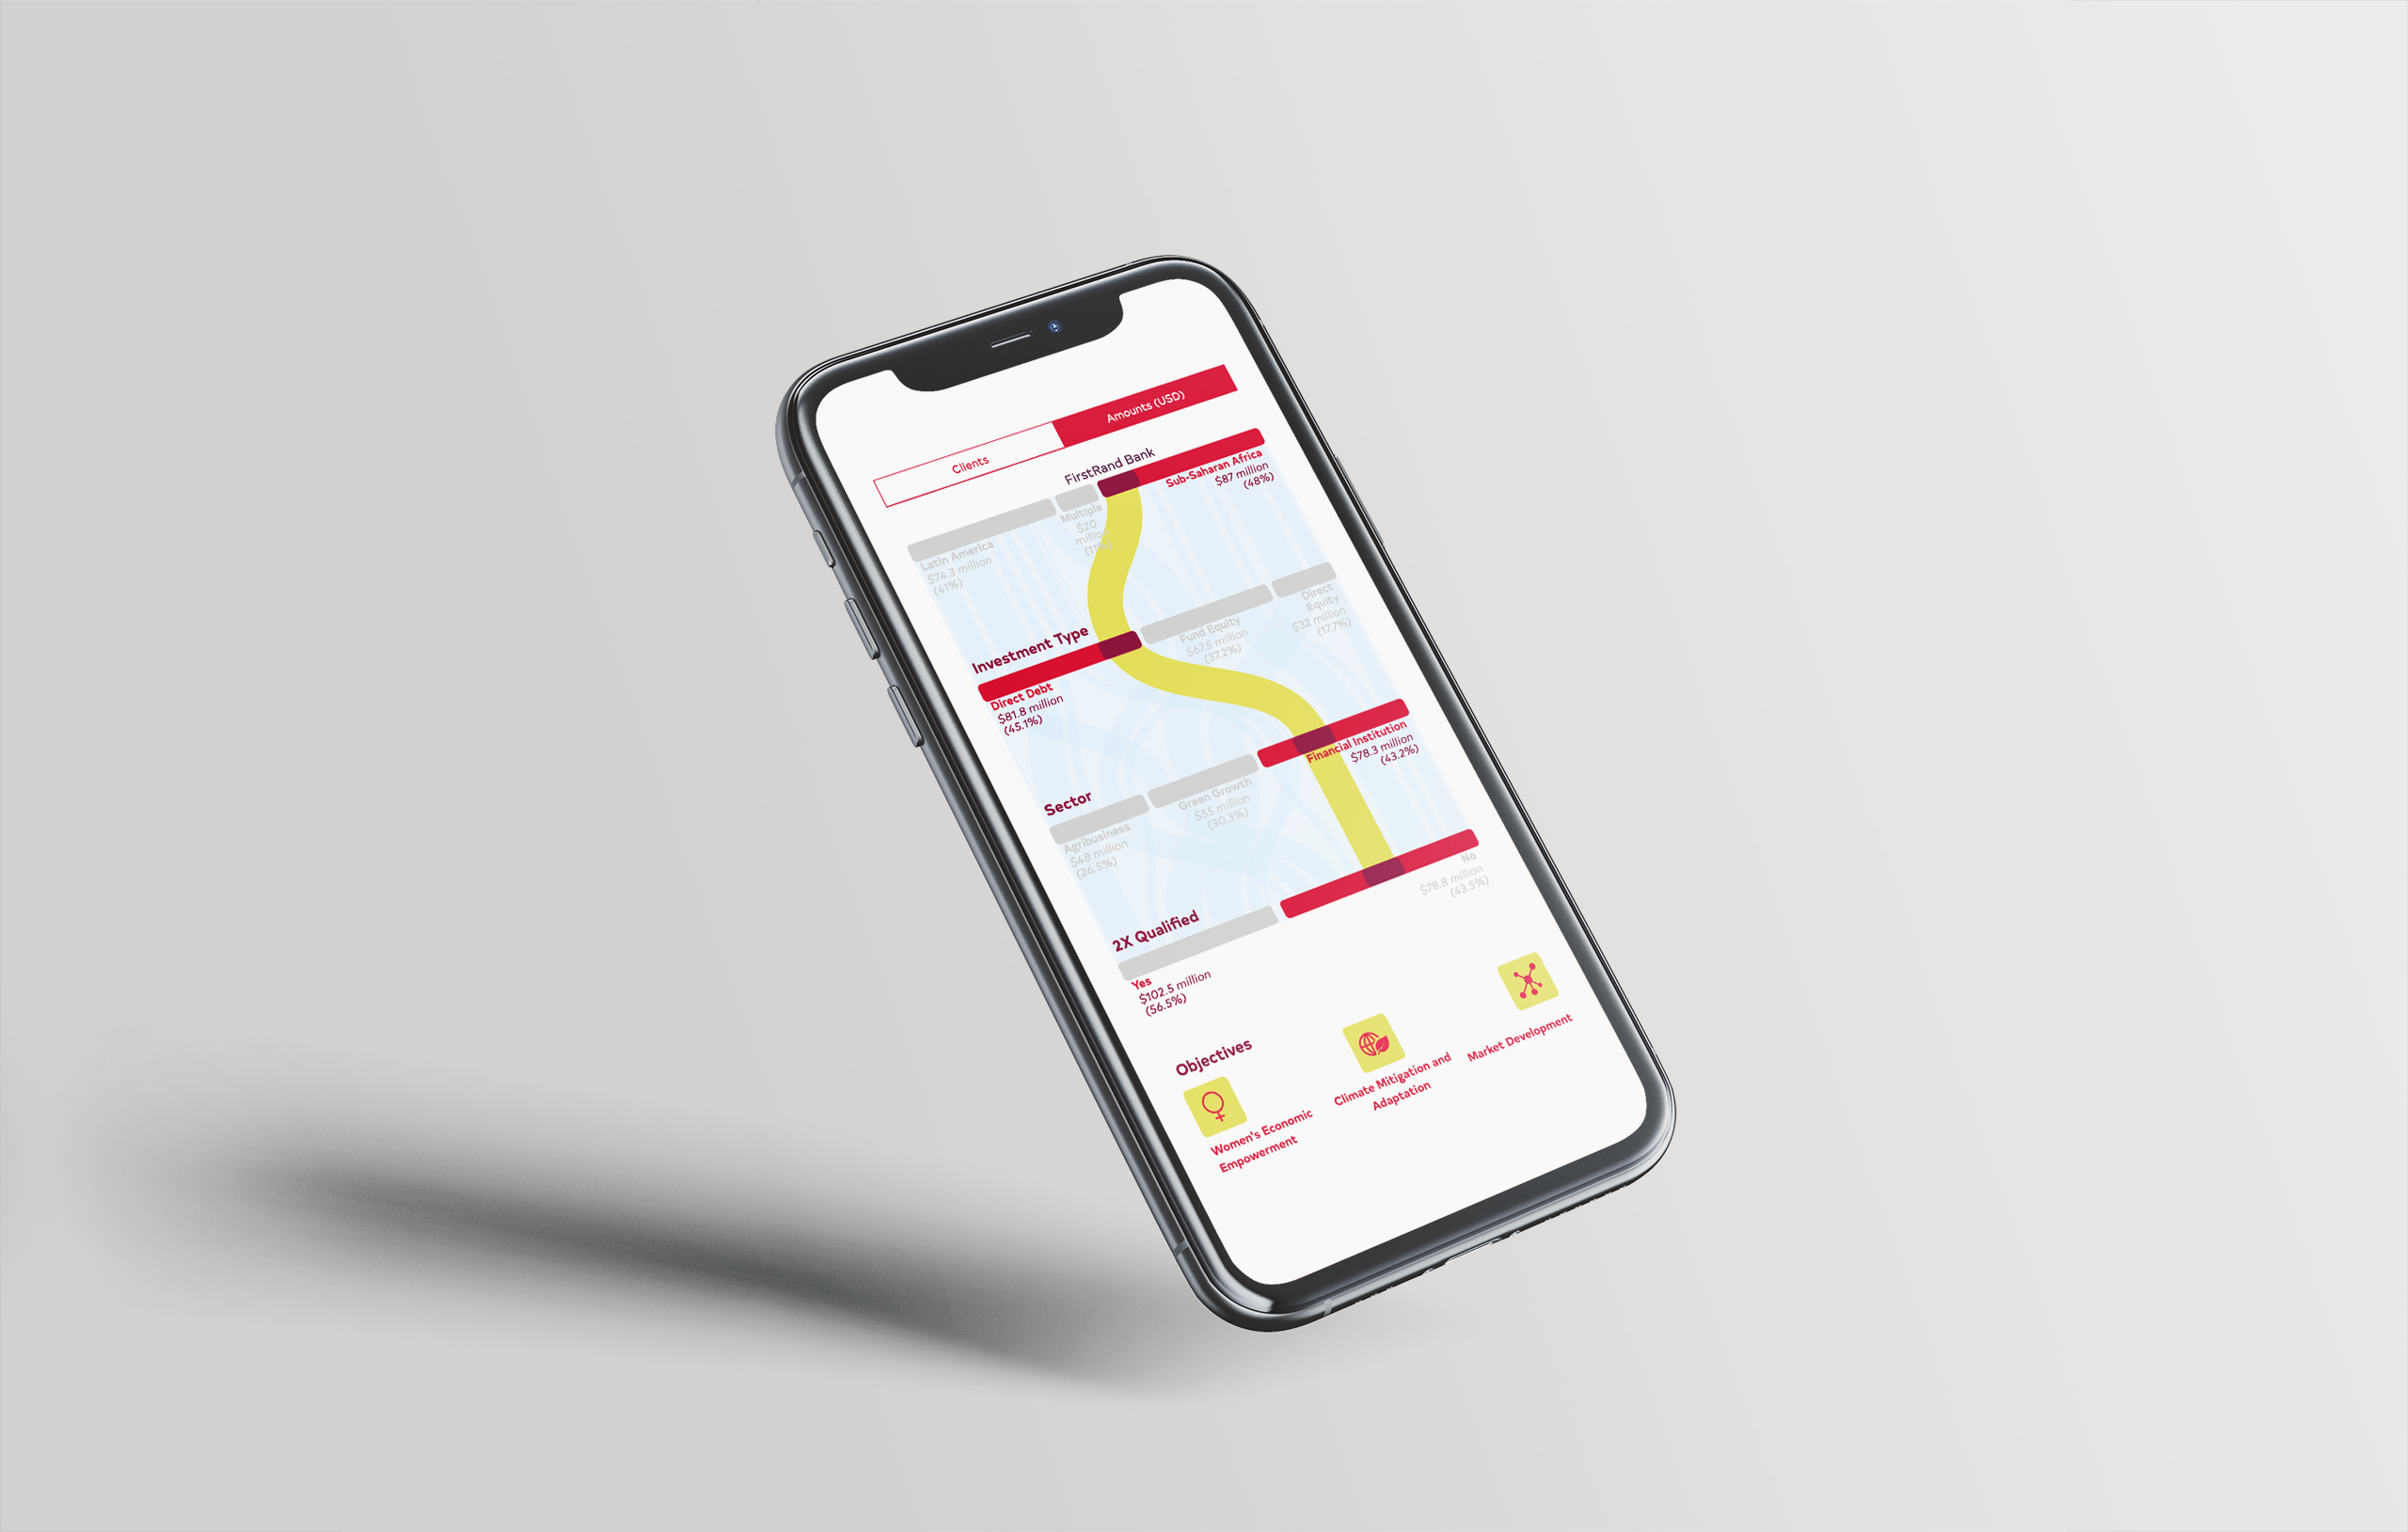
2021has been the year of the interactive. Our first was developed in late 2020 but unveiled in 2021: a portfolio for an international development organization, and I’m immensely proud of it.
We’ve also just finished a dashboard for survey data in a very short time, but I can’t quite talk about it yet.
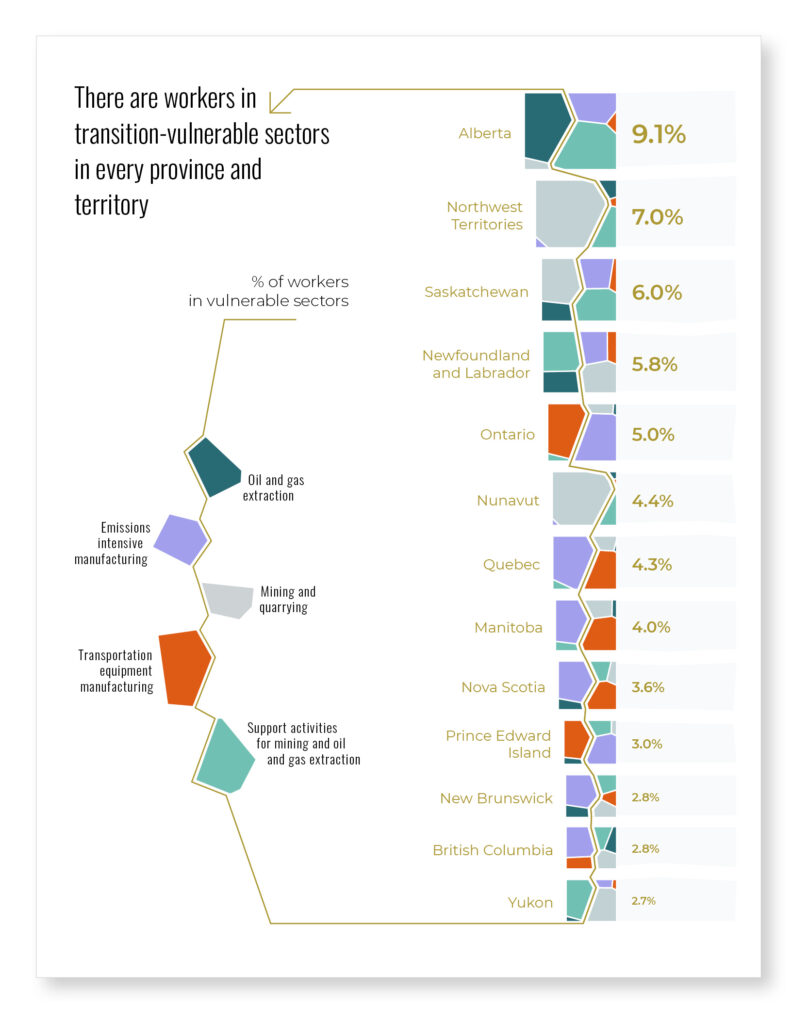
We have kept pushing the aesthetic side of data visualization to reach a wider audience, because content alone cannot do this. The two projects that best exemplify this approach are Sink or Swim and the network graphs of the Tokyo Start-Up Ecosystem.
Another first this year is animations, as we had hoped. There is growing interest in this medium. It is attractive and, as we saw last year with the bar chart races craze, there is something to be said for graphs that gradually reveal their stories.
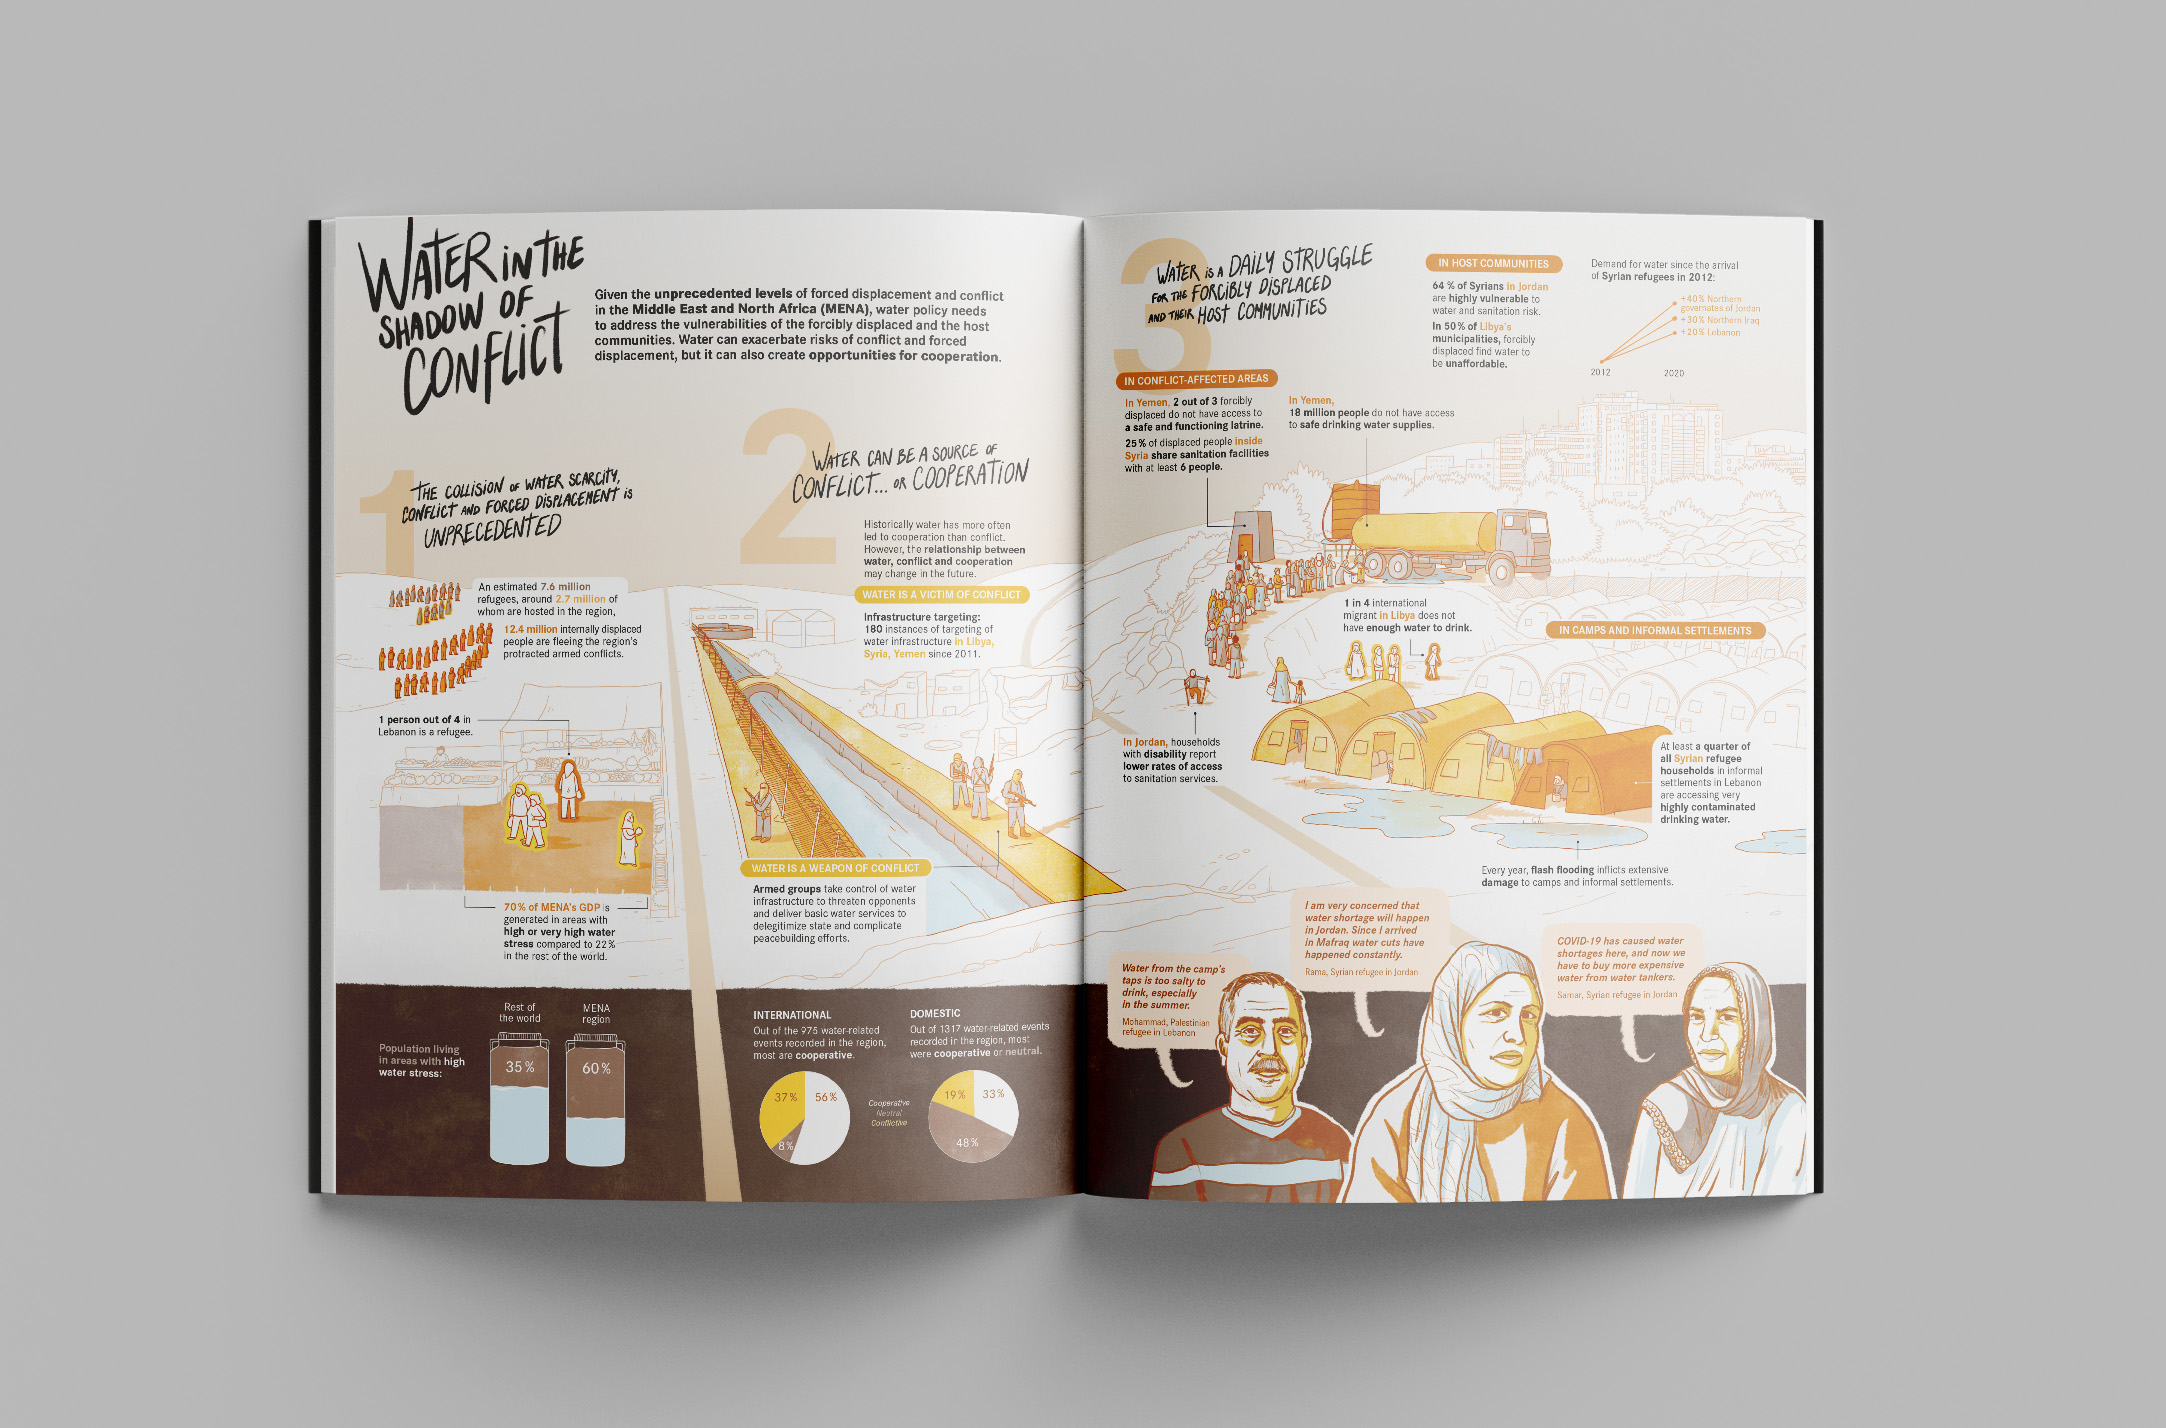
In light of all this growth, I’m especially happy that the vast majority of our projects remain related to sustainable development. It is a big part of what brings us together.
Telling our own story
Communications is the area where we did the least this year, mostly because we had so much to do elsewhere. Still, I wish we had done better and I bear a lot of responsibility for centralizing communications and then not acting on it. We are fixing this.
We published only five blog posts, compared with 11 the year before. I’m especially pleased with the post by Patricia on the Do No Harm guide. I’m also happy to have published in Nightingale, about convincing clients that you are right (when you are).
Frustrated that clients aren’t accepting your design proposals? Getting good design through to production is an important skill in #datavisualization. @chezVoila shares 10 strategies his team uses to increase the chances that clients accept their ideas. https://t.co/oIt291xeAO
— Data Visualization Society (@DataVizSociety) August 3, 2021
We sent five newsletters in twelve months, compared with six in eight months last year. We have adjusted the production process to make it more likely that we’ll publish more often. Click on the image to subscribe.
On Twitter, I had my first brush with semi-virality when a thread about the New York Times cover page for 500,000 COVID deaths got over 500 retweets and a thousand likes. Ironically, the experience mirrored what I was criticizing.
The more I think about today’s front page of the New York Times, the more it is for me another watershed moment for data visualization. But not for good reasons.
This graph is confronting us with the limitations of data visualization to convey tragedies. pic.twitter.com/kwG3zv23NF
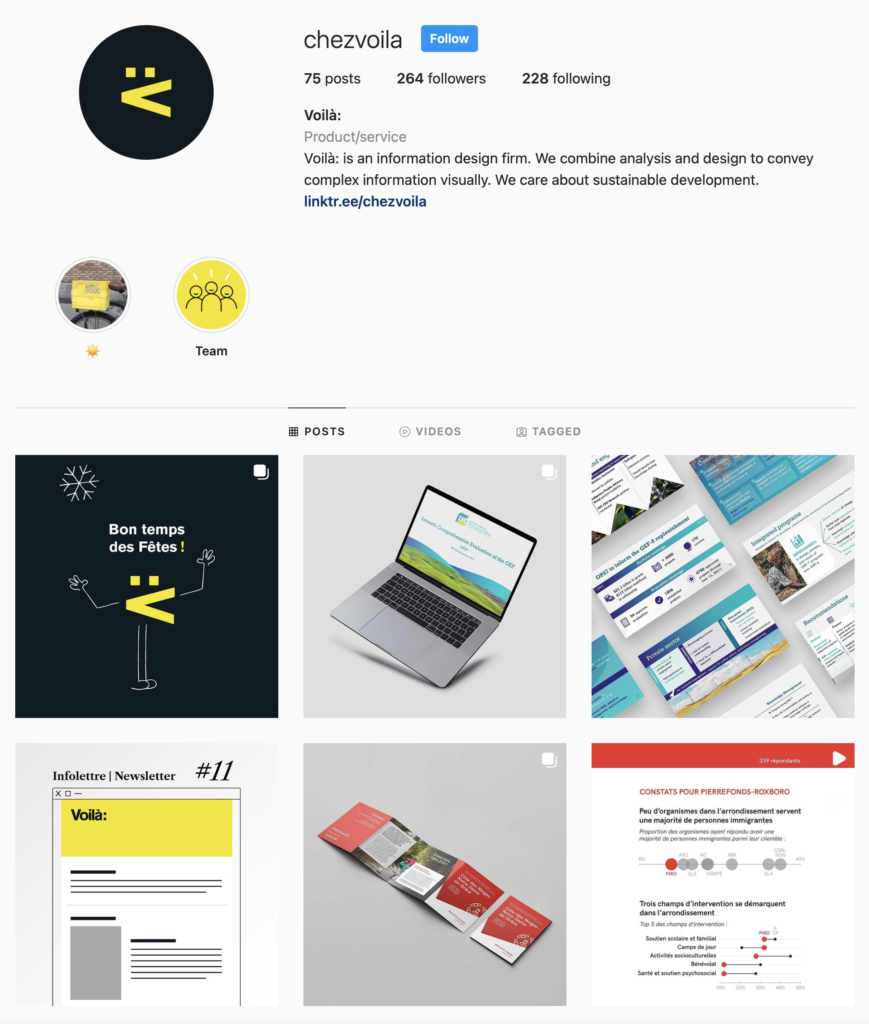
Our Instagram is resurrected! We’re finally posting regularly and it has become the most reliable place to keep up with our projects, more than our website or Twitter (thank you Estelle!). This is also the media that is growing fastest in terms of followers.
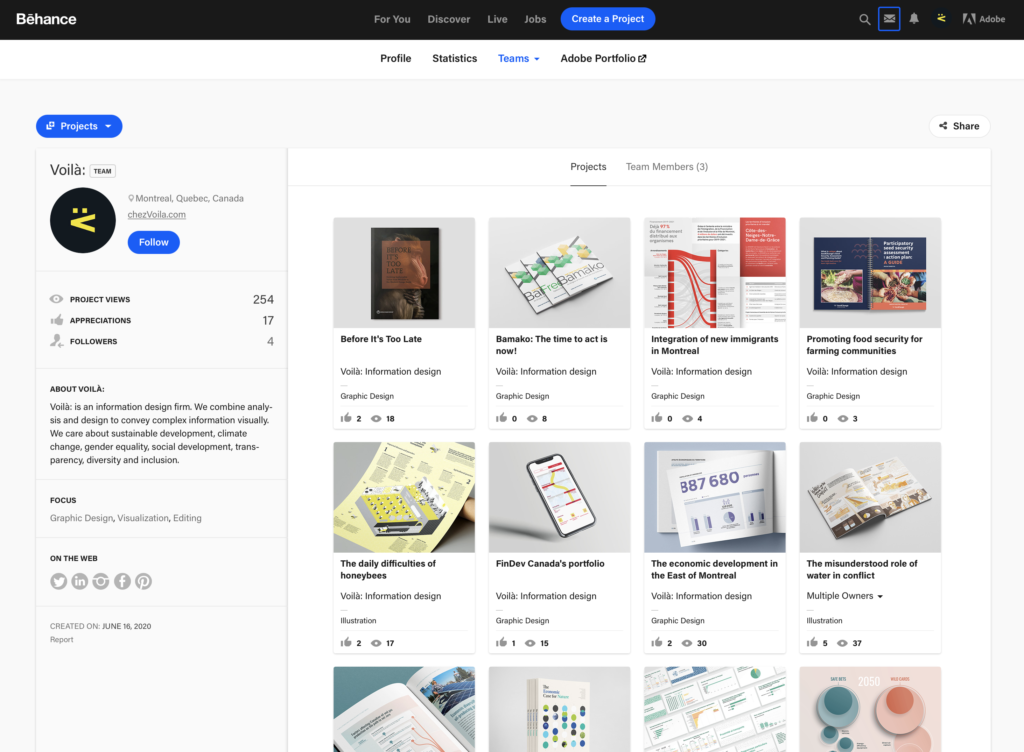
We have finally landed on Behance because our projects deserve this platform centered on aesthetics.
I attended Outlier in February (so well organized) and even led a sort of game at the unconference where we identified details in Hans Rosling’s video for the BBC. It was based on a close study that I had published a year earlier, but I discovered many new details with the group.
Finally, I prepared a short video explanation of slope graphs at the invitation of Jon Schwabish. It took me forever to prepare though and I developed a lot of respect for video explanations.
Invisible progress
There is much that happened behind the curtain. The business had to become more structured to handle this amount of demand and work, including business development, time tracking, invoicing, etc. This will have to continue obviously.
We have done more information architecture than before, helping clients structure their data and messages. We have dealt with larger data sets than ever and are developing methodologies around this.
We have also added to our client list a new international organization, as we had hoped. Nothing to announce yet because the work is just getting started.
What’s up for 2022
We may go back to a real office, but not until it is safe to do so. We expected it to happen this year, but it was not meant to be, with the Delta and Omicron waves. At least, no one at Voilà: has caught COVID so far. Fingers crossed, shots taken and masks on.
Looking at the pace of late 2021 and the pipeline of projects for early 2021, I expect the team to grow again this year. Get a head start by sending us your spontaneous application.
We would like to publish more cross-cutting pieces on our blogs, covering work that took place across projects, like how we design cover pages, how we use alternatives to maps or how we split one graph into several.
The future seems bright, but we take nothing for granted. Here’s hoping that the world and us will have good news to share here in another twelve months.