



A report redesigned with pop colors
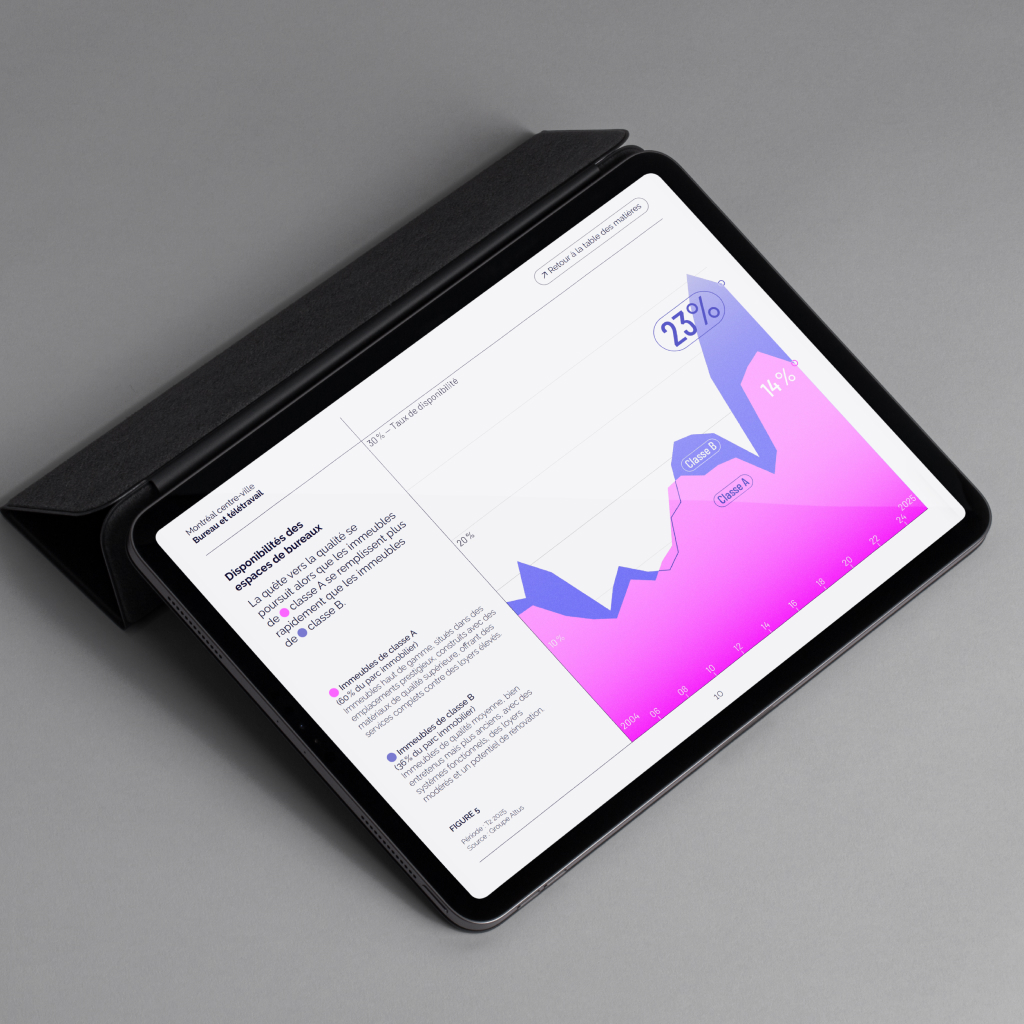
A portrait of downtown Montreal highlighting graphic charts Montreal centre-ville wanted to rebrand its annual report by offering a creative, visual interpretation of its data, moving away from the traditionally text-heavy format. For the eighth edition, Voilà: redesigned the report around clear, vibrant charts designed for clear interpretation. Design as a tool for clarity The […]
2025 Progress Report on the Climate Plan for Ville de Montréal: from understanding to popularization
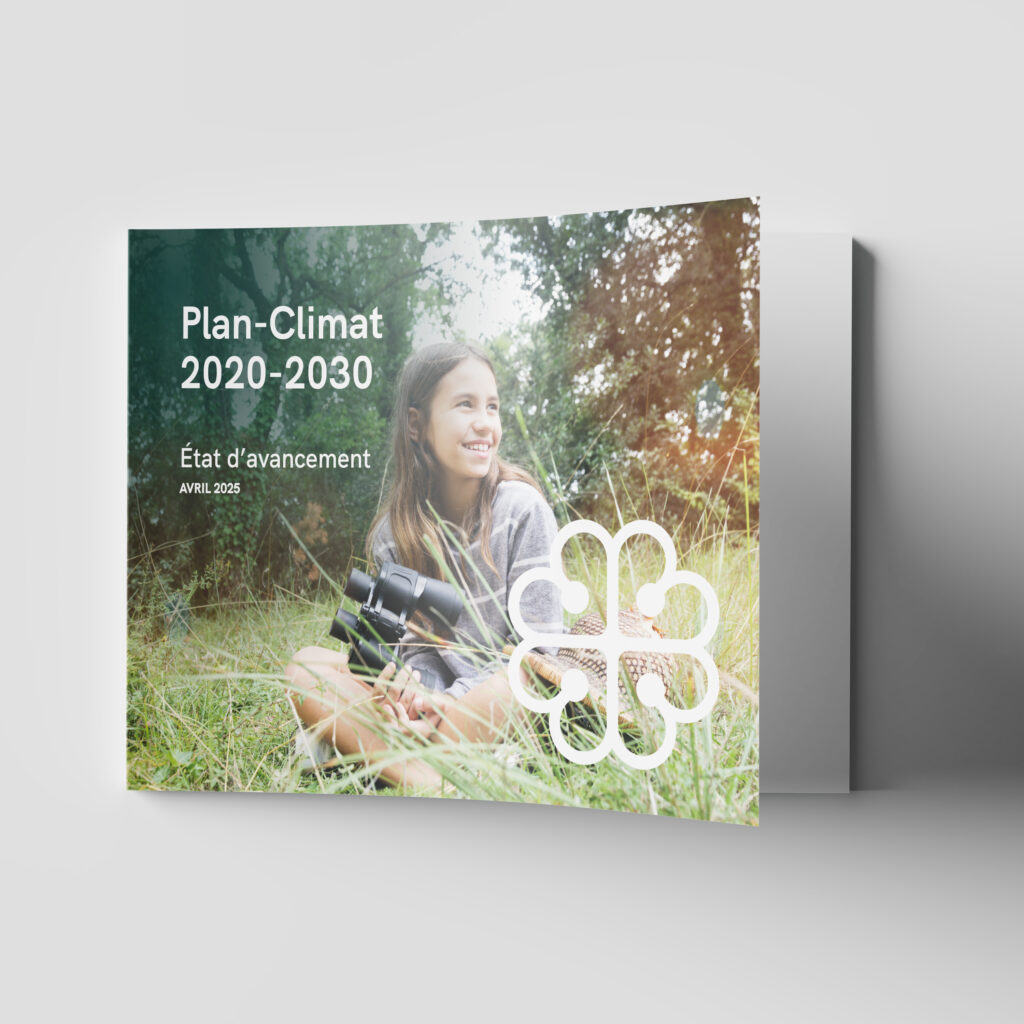
2025 Progress Report on the Climate Plan for Ville de Montréal: from understanding to outreach In April 2025, Bureau de la transition écologique et de la résilience (BTER) commissioned us to present the 2025 Progress Report on the Climate Plan ahead of the Montreal Climate Summit. With the 2020-2030 Climate Plan halfway through, the BTER […]
Establish government-wide data visualization standards
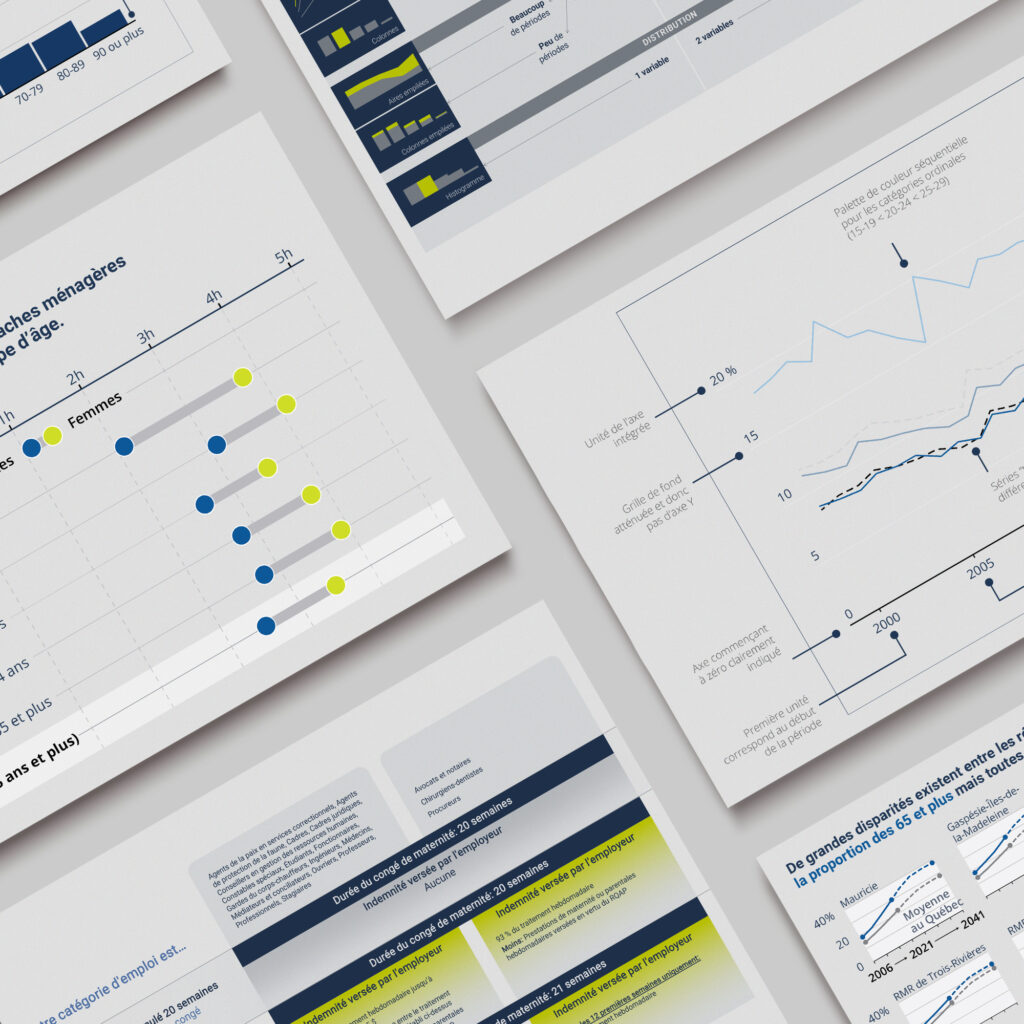
Establish government-wide data visualization standards The Gouvernement of Quebec asked Voilà: to create a data visualization style guide to equip the whole Québec.ca’s website with a common visualization language. The result? Greater clarity and accessibility of the information shared with the general public Created to be useful The style guide is structured by function and includes […]
Heating our buildings without impacting the climate
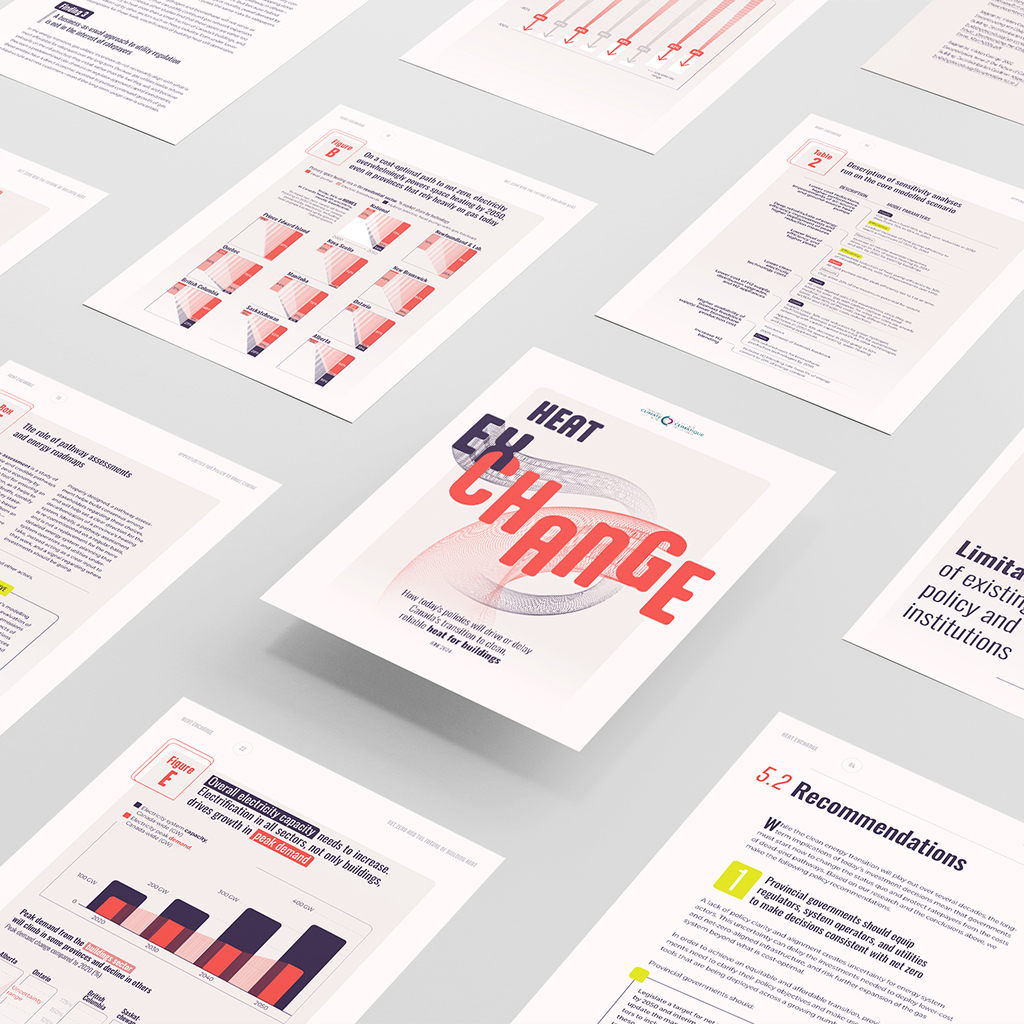
Heating our buildings without impacting the climate In collaboration with Voilà:, the Canadian Climate Institute has developed a new report on the impact of today’s policies on the transition of buildings to a cleaner and more reliable heating system. The aim of this project was therefore to draw public attention to the invisible challenges associated […]
Creating a narrative to explain the impact of Economic dynamism
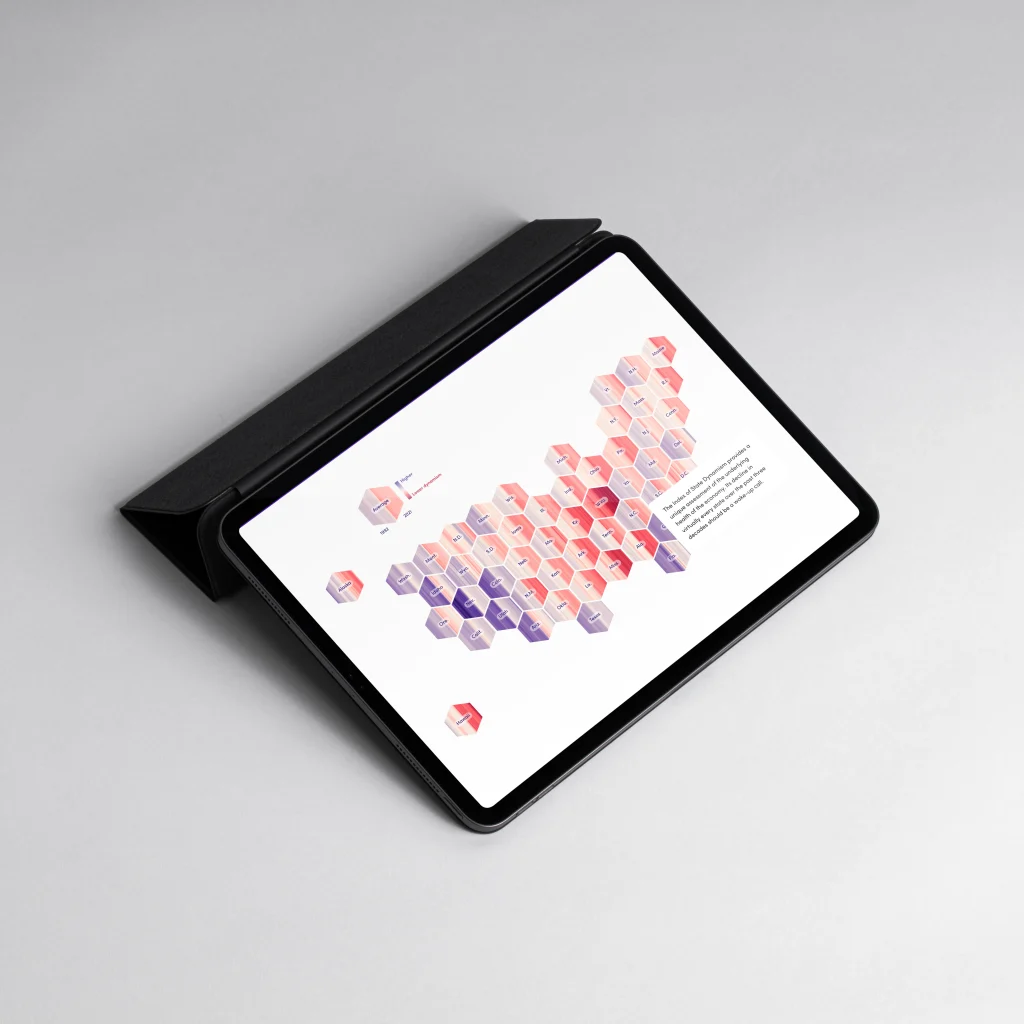
Creating a narrative to explain the importance and impact of Economic Dynamism In collaboration with the Economic Innovation Group, we clarified the nature and impact of economic dynamism in the United States. The result is an interactive that presents its history and how it has behaved state by state. We aimed to create an experience […]
Tracking Canada’s progress toward Net Zero emissions

Tracking Canada’s progress toward Net Zero emissions Is Canada on track to meet its 2030 emission reduction goals, and how far might it be from a path toward Net Zero? The Canadian Climate Institute conducted an independent assessment of Canada’s emissions reduction plan and came to us to showcase the results. Clarifying the structure Before […]
A comprehensive assessment of the cost of climate change for the Canadian population

A comprehensive assessment of the cost of climate change for the Canadian population The Canadian Climate Institute has published the latest in a series of studies on the costs of climate change, demonstrating that the financial health and prosperity of Canadians are at risk. It is aimed at decision-makers, urging them to take action. The […]
Data visualization for women’s economic empowerment
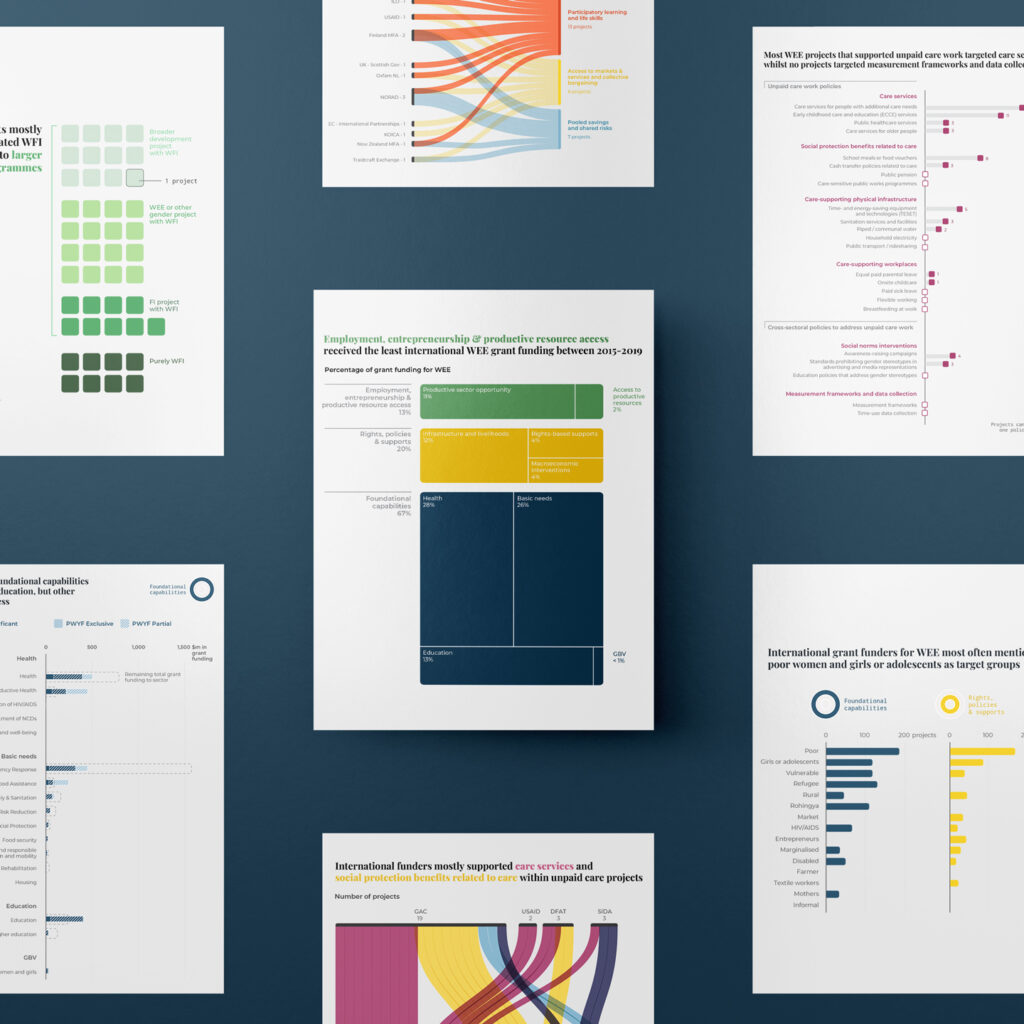
Bringing transparency to international aid for women’s economic empowerment Publish What You Fund is a non-profit organization ensuring international aid and development data is transparent and available, and actionable. In October 2020, they launched a project aimed at improving transparency in the financing of women’s economic empowerment, tracking several key indicators. We partenered with them […]
Freeing the US from its culture of detention
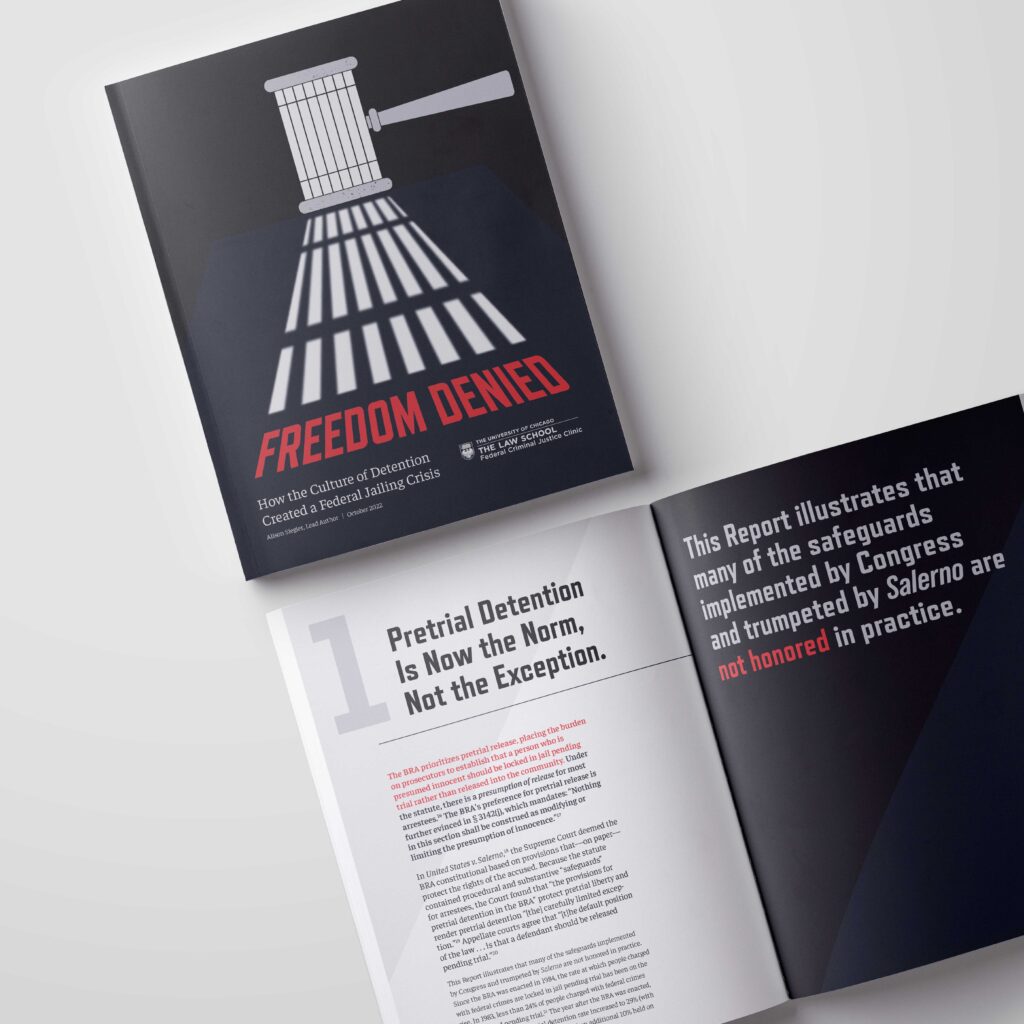
Freeing the US from its culture of detention The University of Chicago Law School needed to get the most visual impact for a wide range of troubling statistics on the culture of detention that had taken root in the US justice system. The study shows with hard evidence that there is a complex systemic issue. […]
A new look at the performance of residential and long-term care centres in Québec
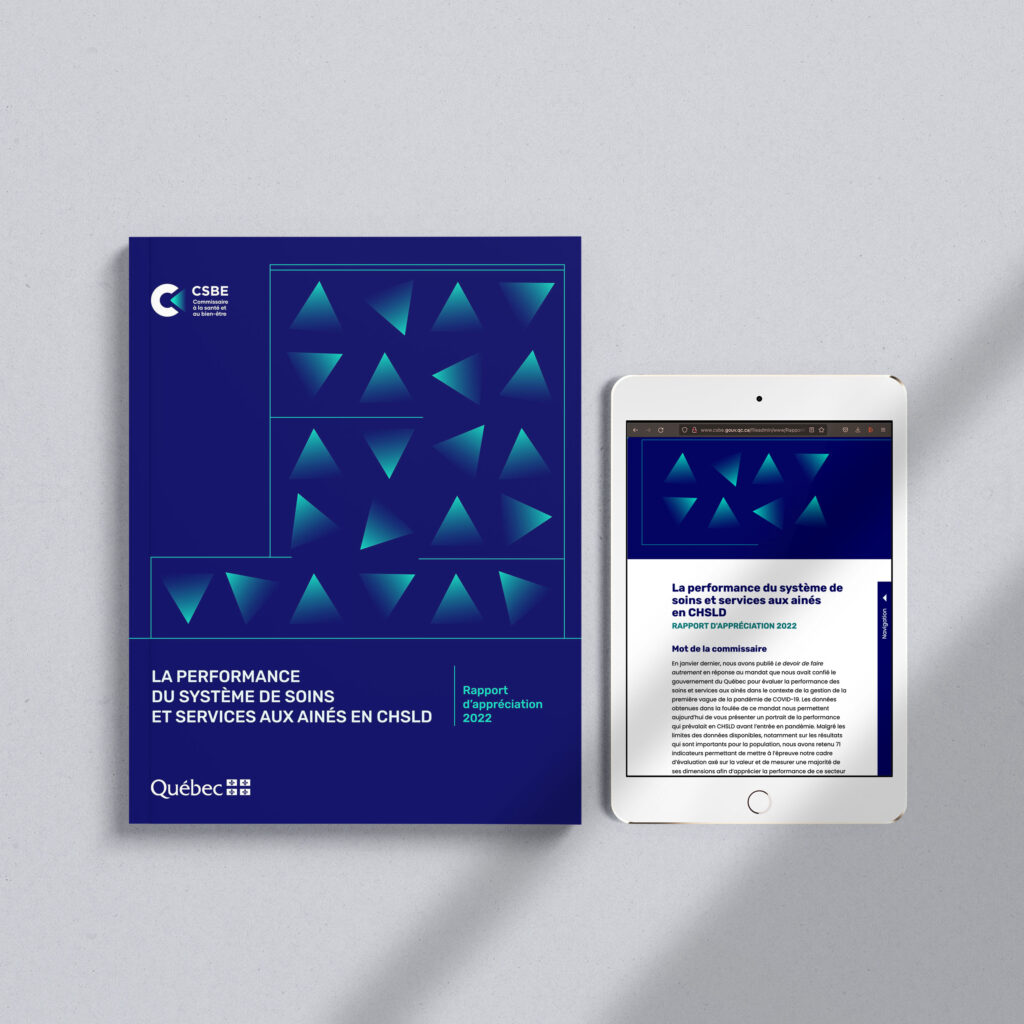
A new look at the performance of residential and long-term care centres in Québec The CSBE had a new method for evaluating the performance of long-term care facilities, which highlights major disparities across the territory. We accompanied them in the presentation of their study results, which highlighted numerous points for improvement in order to reach […]