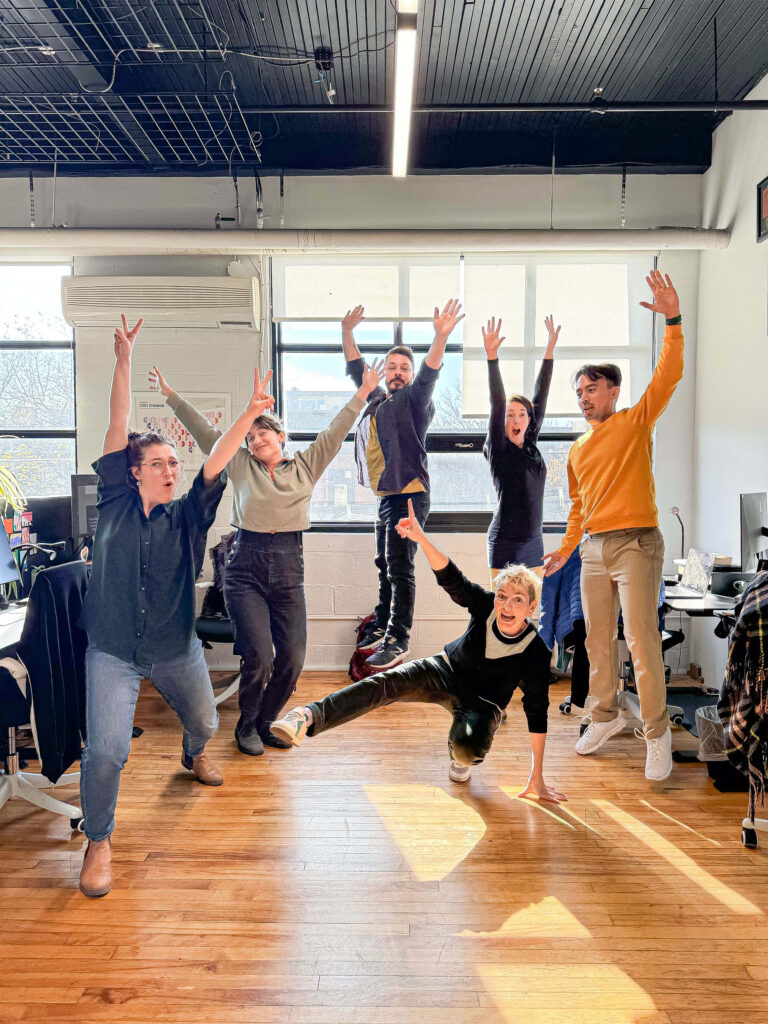
The ongoing improvement is essential in our ways of doing – change is then constant. Over the years, those retrospectives allow us to capture the progress that has been made.
Human resources
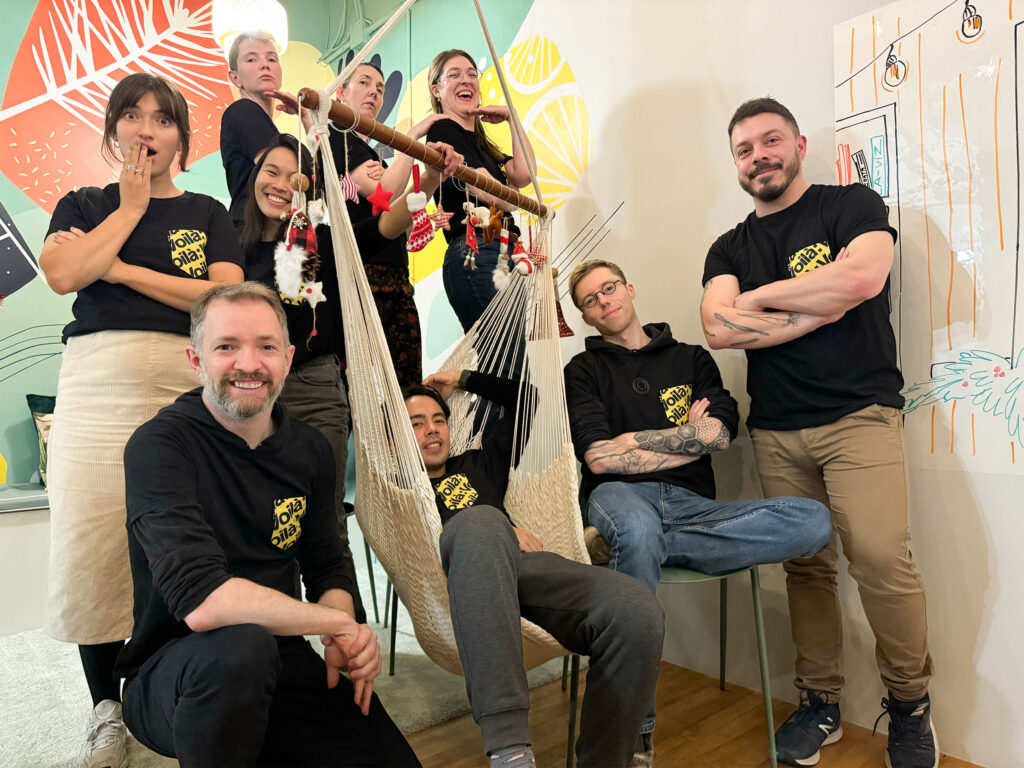
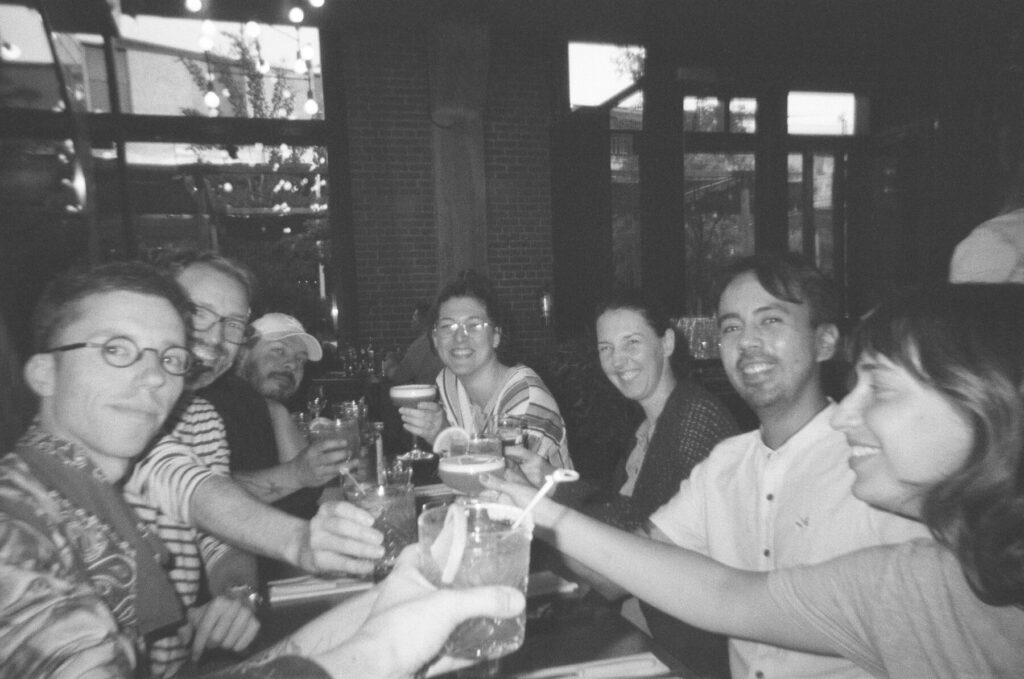
Joining the team around the same time, Patricia and Timour also left just a few months apart after three years and a half at Voilà:. Their contribution to a growing organization was truly impactful.
Such departures in a small team bring a sense of renewal: we are taking the opportunity to recruit (our call for application is still ongoing by the way) and to rethink the structure of the organization. We aim to expand our network of collaborations.
You wish to be part of it? Write to us!
Recognition
To get more recognition, we applied to more awards this year and we’ve been rewarded starting with two Anthem Awards. They celebrate organizations dedicated to making the world a better place. We are proud to be next to other winners such as the United Nations, TED, BBC, Amnesty and PBS.
Silver – Sustainability, Environment & Climate
Sub-category: Best Use of Data
440 Megatonnes Pathways Tracker
Bronze – Data in Humanitarian Action & Services
Sub-category: Best Use of Data
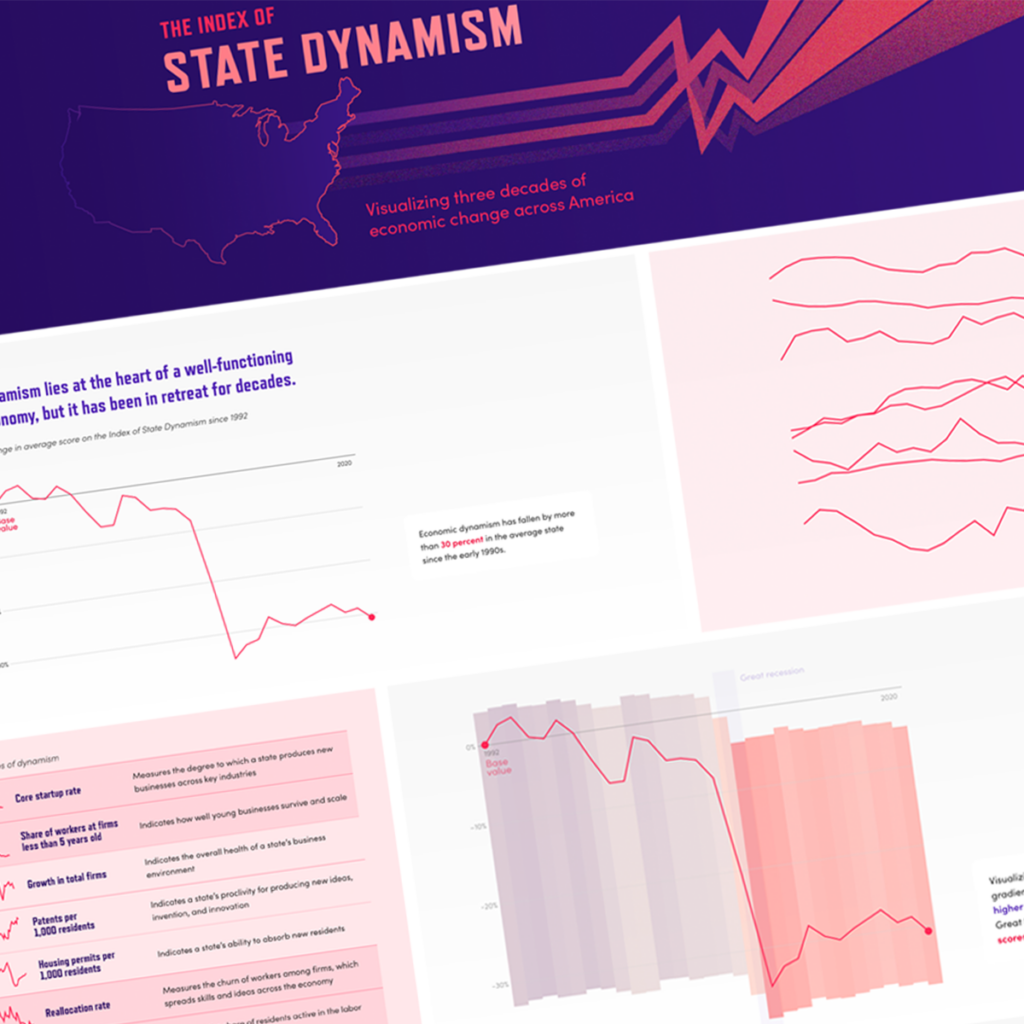
Index of State Dynamism
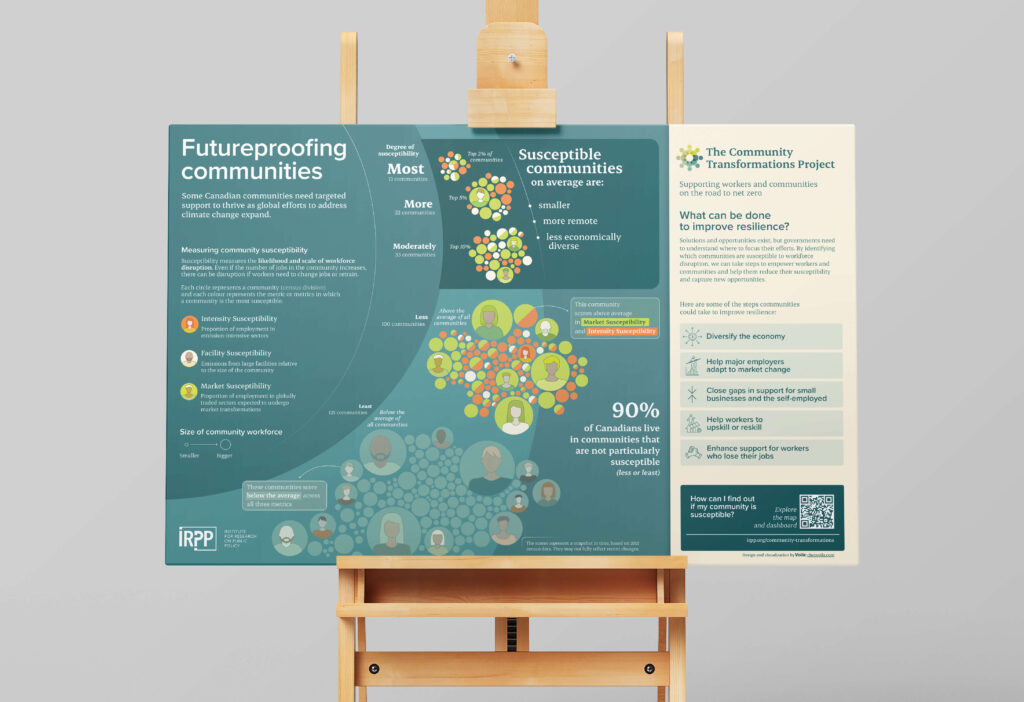
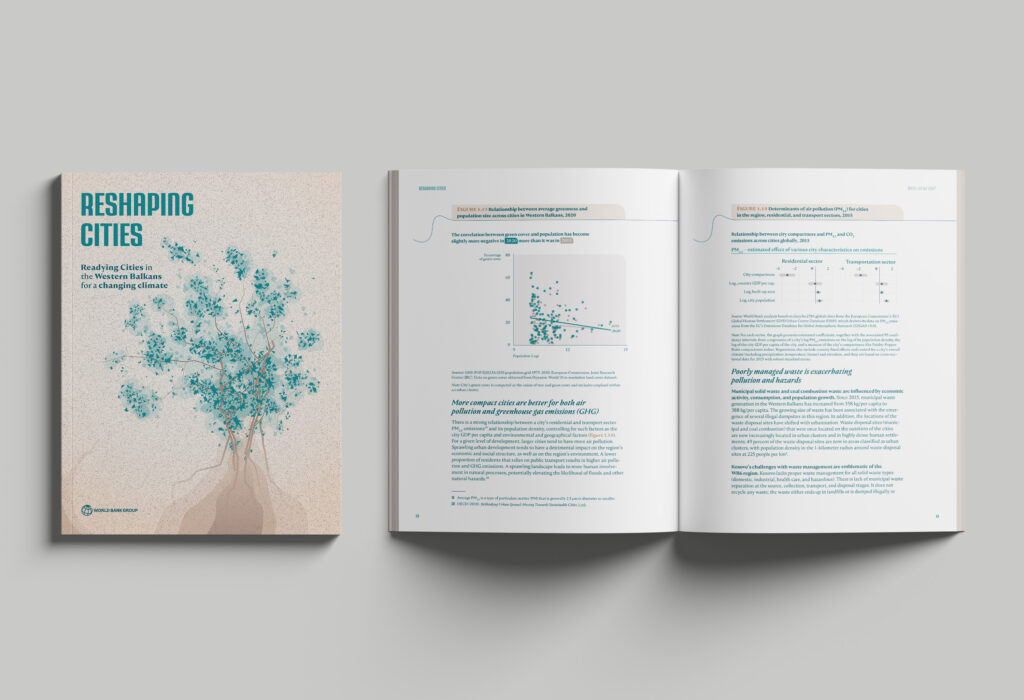
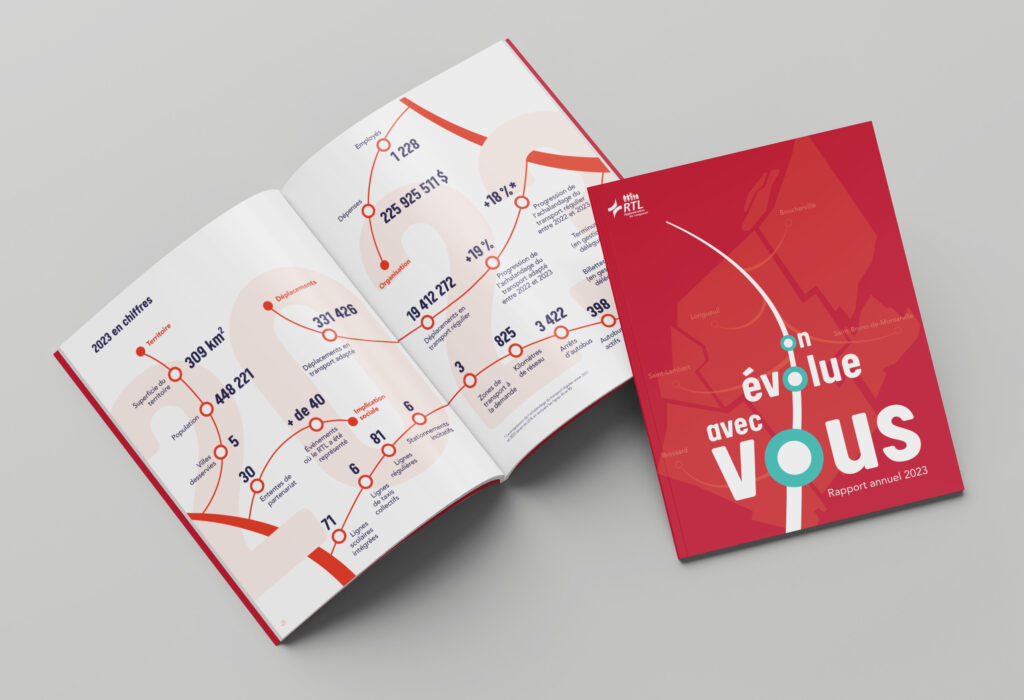
Spotlight on the several projects added to our portfolio to highlight what we did.
Economic dynamism by US state
Two in one: a story within the data and a dashboard to give control to the readers. One of our winning projects.
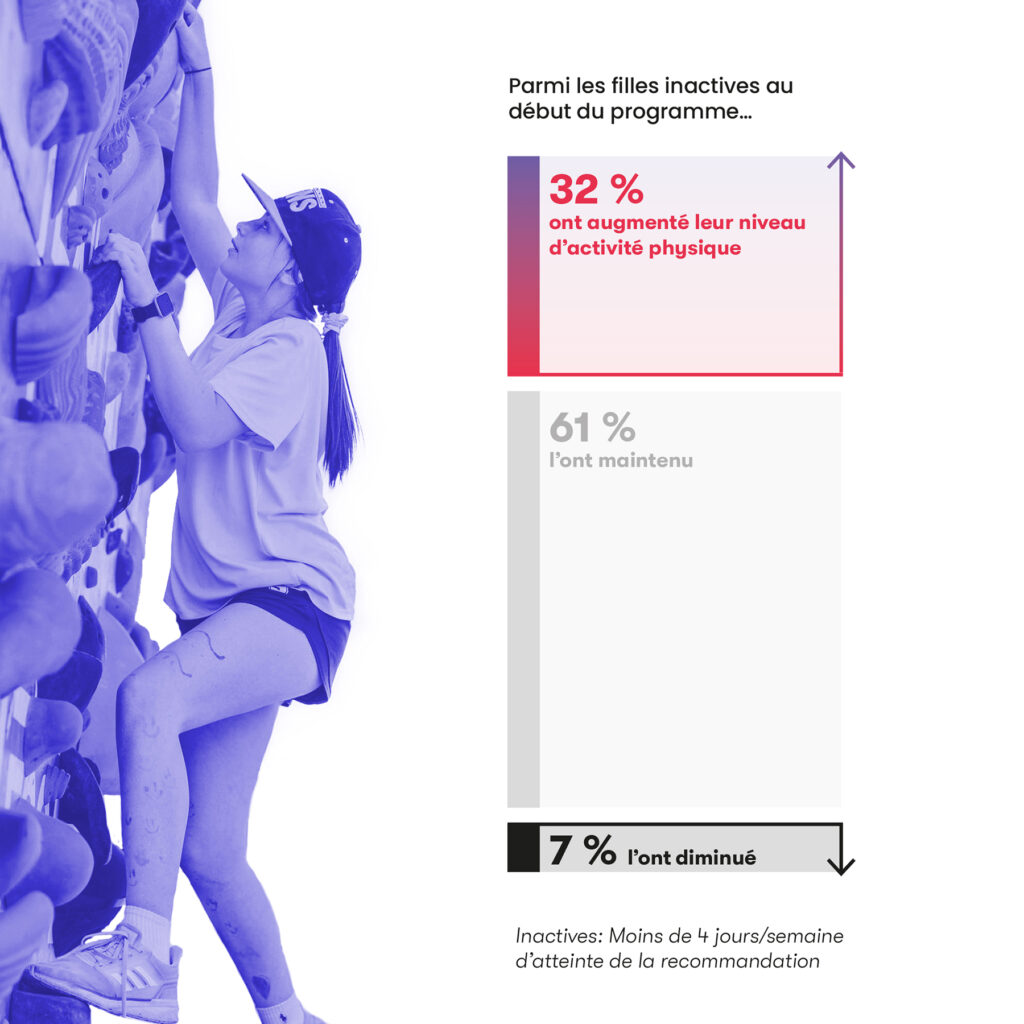
Fillactive, ça marche!
A Quebec organisation that wanted to communicate the results of a study on its impact (in French).
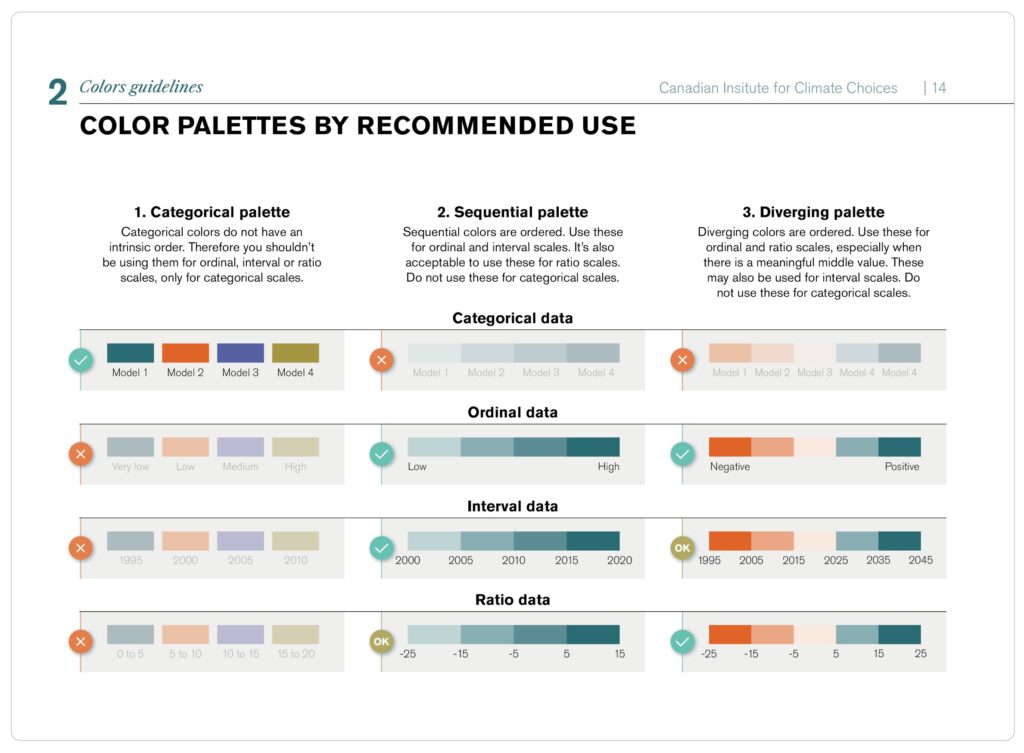
Standards for climate charts
To highlight one of our little-known products: standards guides for data visualization.
Projects and clients
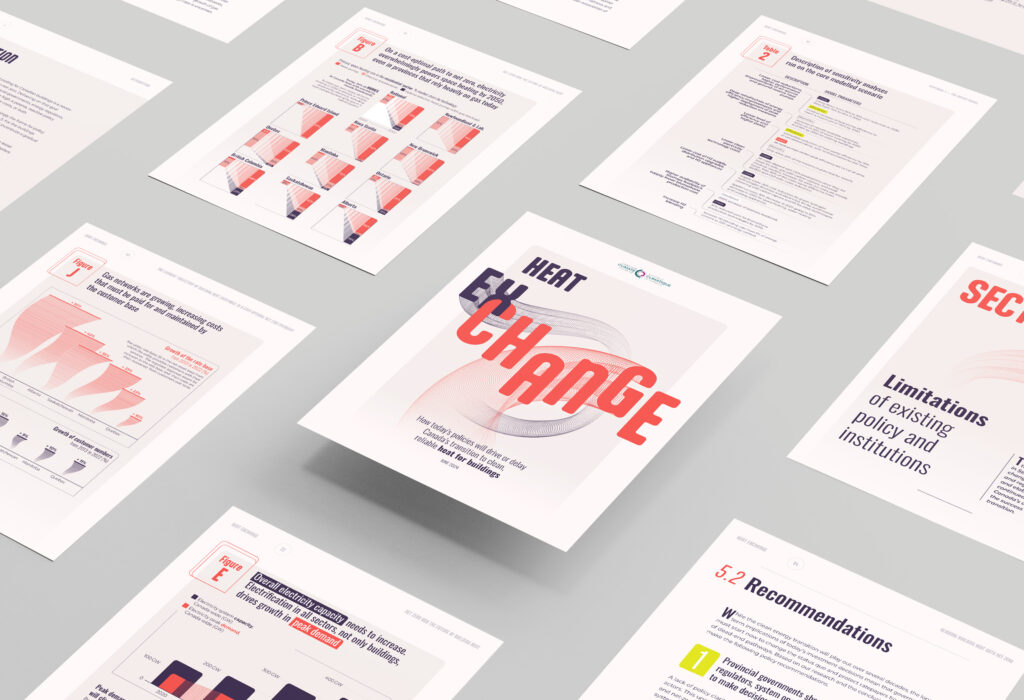
The years are always busy and 2024 is no exception. We gave eight training sessions in data visualization. Here are also several projects that are memorable to us.
On a less positive note, a client went bankrupt, taking their unpaid invoices with them — a first for us.
In-house management
The implementation of our strategic plan has been the most completed since our beginning. The annual theme was clarity. One of our biggest wins is documenting our internal processes, to facilitate collaboration and its integration. I am also thinking of all the work we’ve done to improve the customer experience.
Communications
Social media made us busy.
We have completely left X, a platform that causes too much harm for those who create content, power and income.
We chose to migrate to Bluesky and in one year, we gathered 3000 subscribers.
Join this data visualization community with this starter kit.
Here you go. 🫡
Please share widely to help develop the dataviz community of Bluesky. 📊
go.bsky.app/R3nSyyy
— Voilà: Francis Gagnon (@chezvoila.com) September 1, 2024 at 2:21 PM
Our other platforms, such as Instagram (23 posts!) and Linkedin (38 posts!) have been very active and have seen strong growth, with better fitted content. There is more creativity than ever though an increasingly integrated and harmonious strategy.
Representation
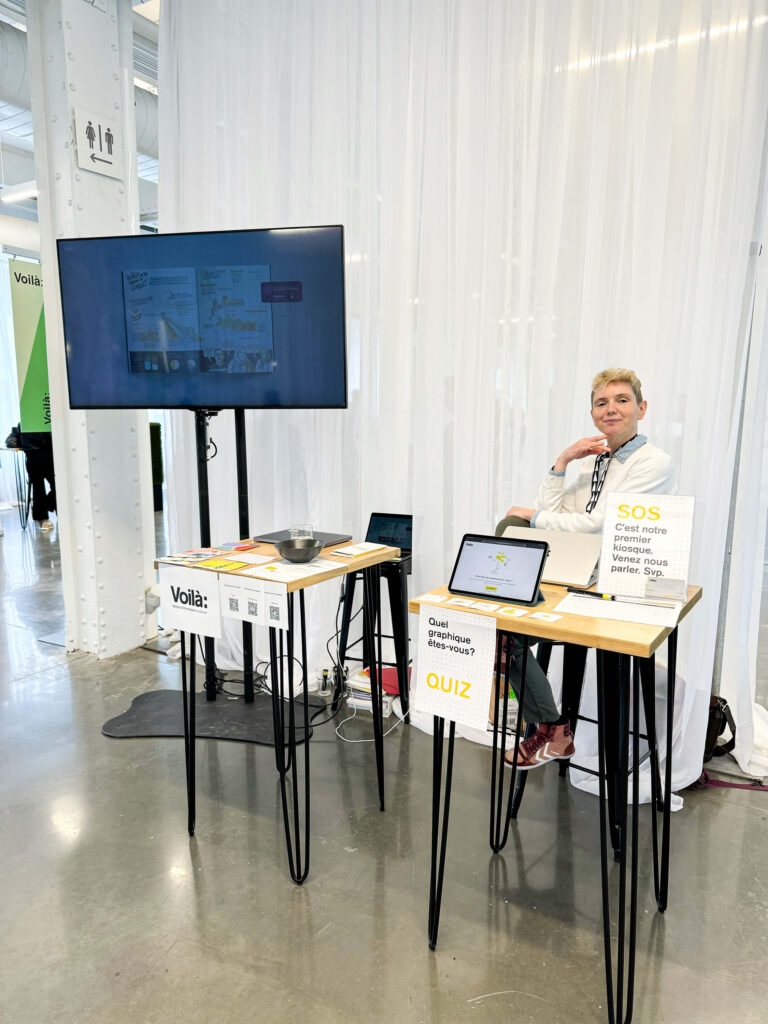
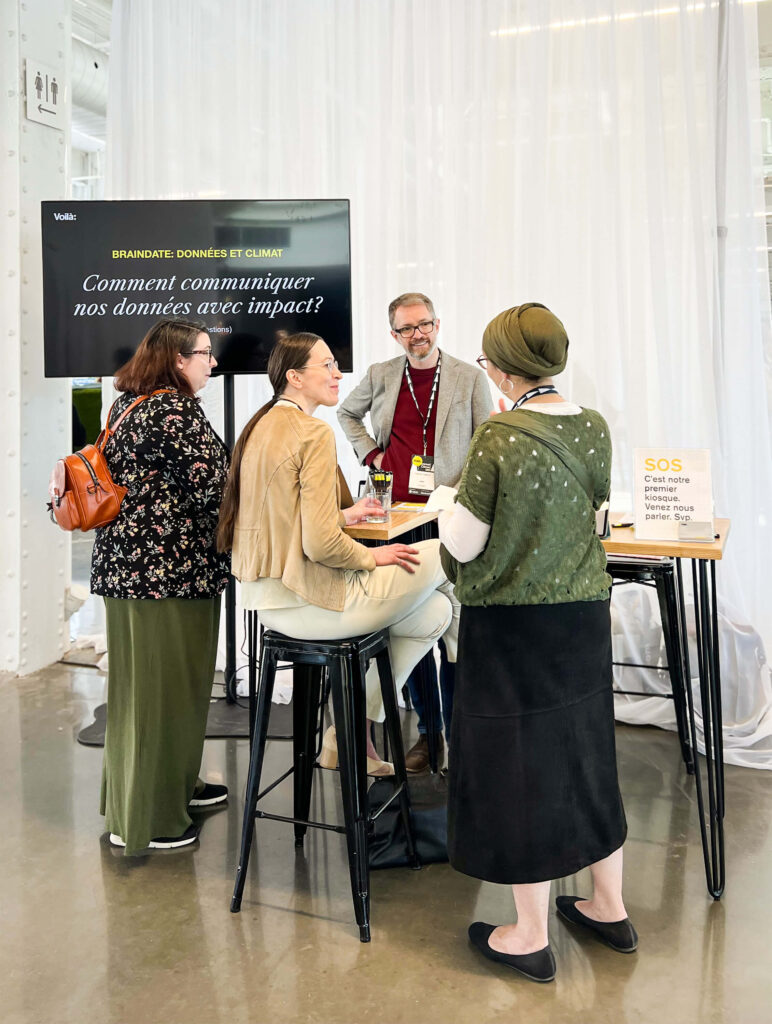
With the goal of increasing our visibility in our field, we set up our very first booth at the Montreal Climate Summit. It was a success!
I’ve also taken part in more events than ever to inform myself and spread the word about Voilà:, such as the annual conference of the Association des économistes québécois, of which I’m a member; Avantage carboneutralité, organized in Ottawa by our client the Canadian Climate Institute, Rendez-vous 2024 by Comm Climat, and the launch of the Vital Signs report by Vivre en Ville. It looks like it’s all worth it, because I’m starting to recognise people and they’re starting to recognise Voilà:!
2025 vision
In entrepreneurship, I no longer expect stable or easy years. It’s like rafting, and you have to learn to enjoy it. In fact, I’ll be taking my first training course for entrepreneurs, called Parcours Novaré. I’m putting a lot of hope into it, as I don’t come from an entrepreneurial background.
We’re also going to develop more affordable services for customers with tighter budgets who also want to do business with us.
This year we will have our first communication plan, which will enable us to be more coordinated and better targeted.
Overall, the theme of the 2025 strategic plan will be quality, which means that once we have clarified our processes, we will define our products and services.
The main question will be ‘What is a report/graphic/infographic/etc done by Voilà:?
We want customers to know what to expect when they give us their projects.
Francis Gagnon is an information designer and the founder of Voilà: (2013), a data visualization agency specialized in sustainable development.
