Encouraging economic development in the East of Montreal
The Chambre de commerce de l’Est de Montréal (CCEM) defends and promotes the socio-economic development of the city’s East. After extensive research and consultation with many strategic allies, the CCEM wanted to bring together in a single document the list of actions to adopt to develop the full economic potential of the East by 2030.
In addition to text, images and maps, the white paper contains graphics, tables and figures. The CCEM asked Voilà: to provide structure and to clarify its purpose while respecting a graphical guidelines established together.
Beyond the graphics and layout work, our attention was especially focused on formatting the data and the message to convey in each chart.
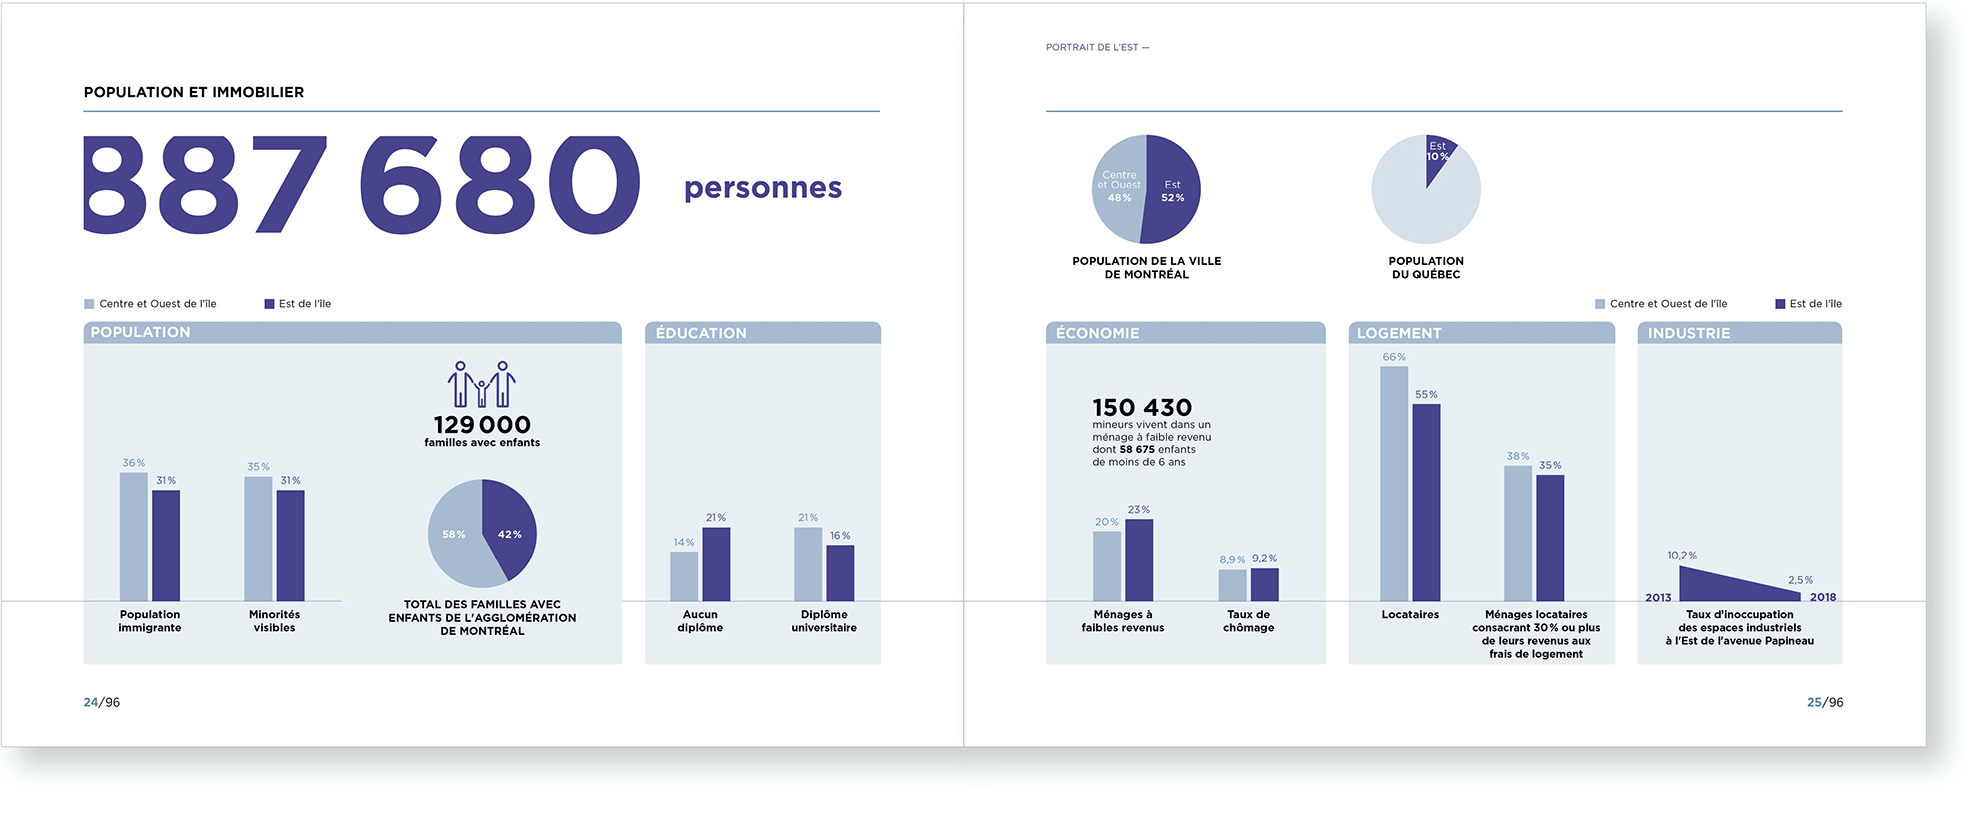
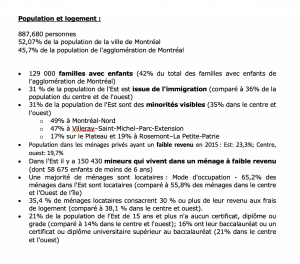
Population and real estate
There are many statistics that demonstrate the historical delay in the development of East Montreal compared to the rest of the metropolitan area.
Initially written in the form of a list, this quantified information which paints a portrait of the population and real estate in Eastern Montreal has been classified and grouped by themes, represented by pale colored backgrounds.
Most aspects compare East and West very simply. We have therefore chosen to use bar graphs aligned on the same axis, to allow easy horizontal reading as well as a global overview of the situation in the east (in dark blue) at a glance.
Before
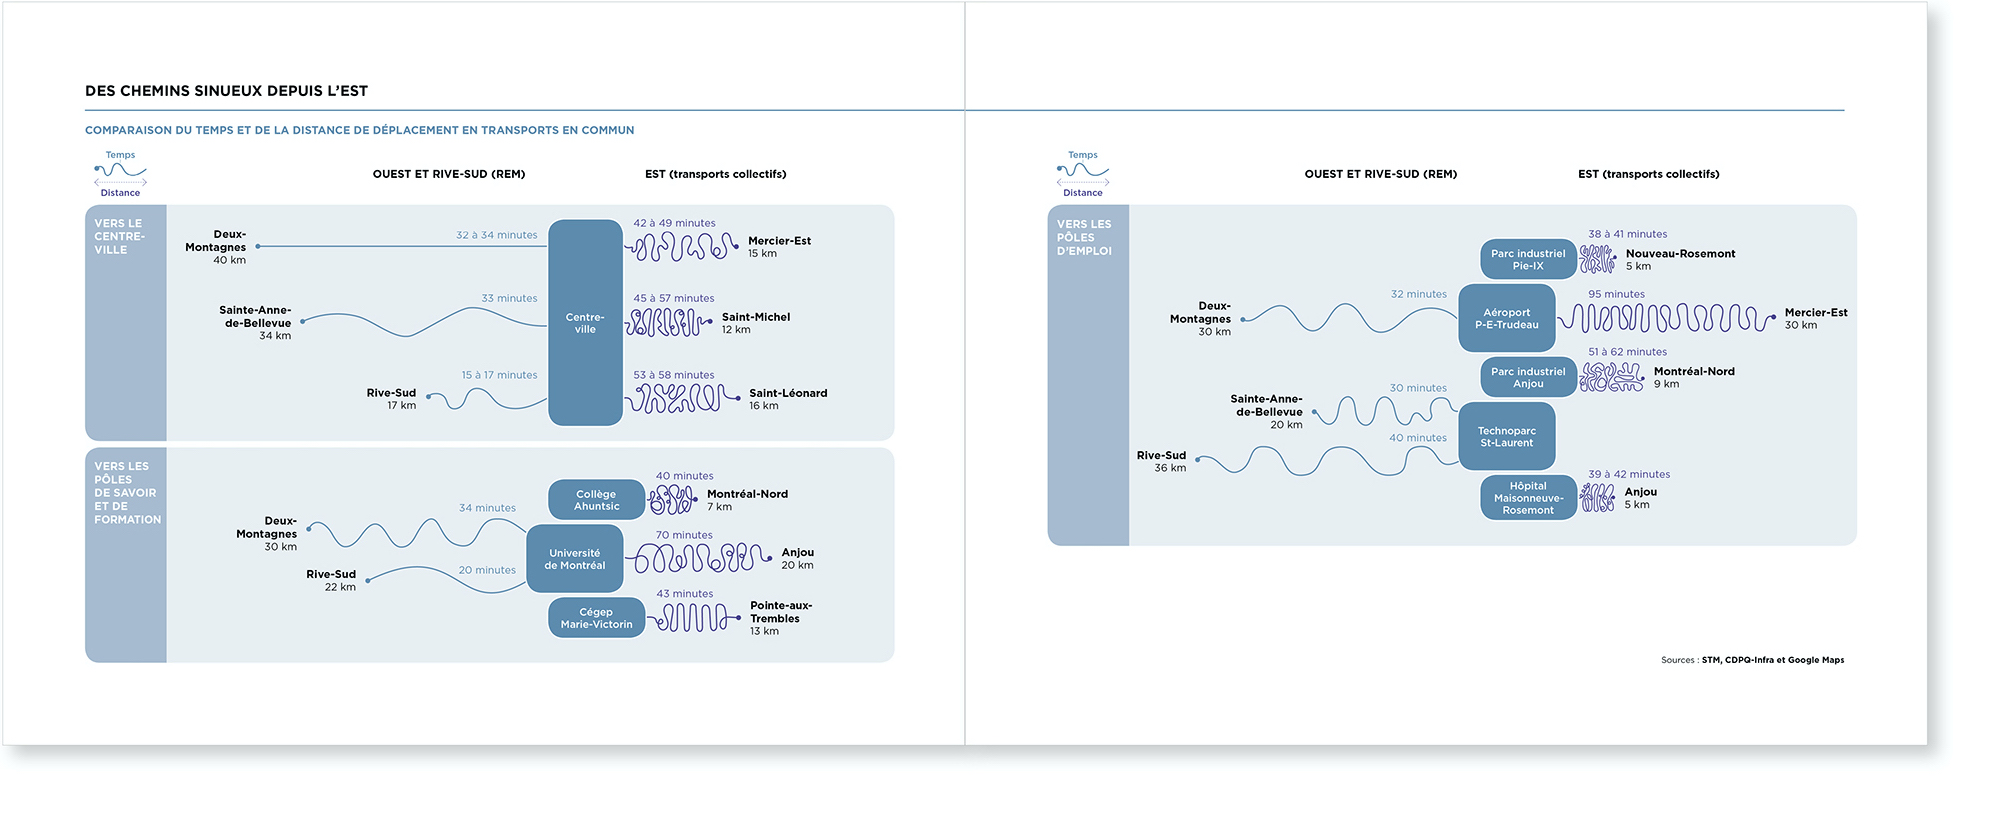
Winding commutes from the East
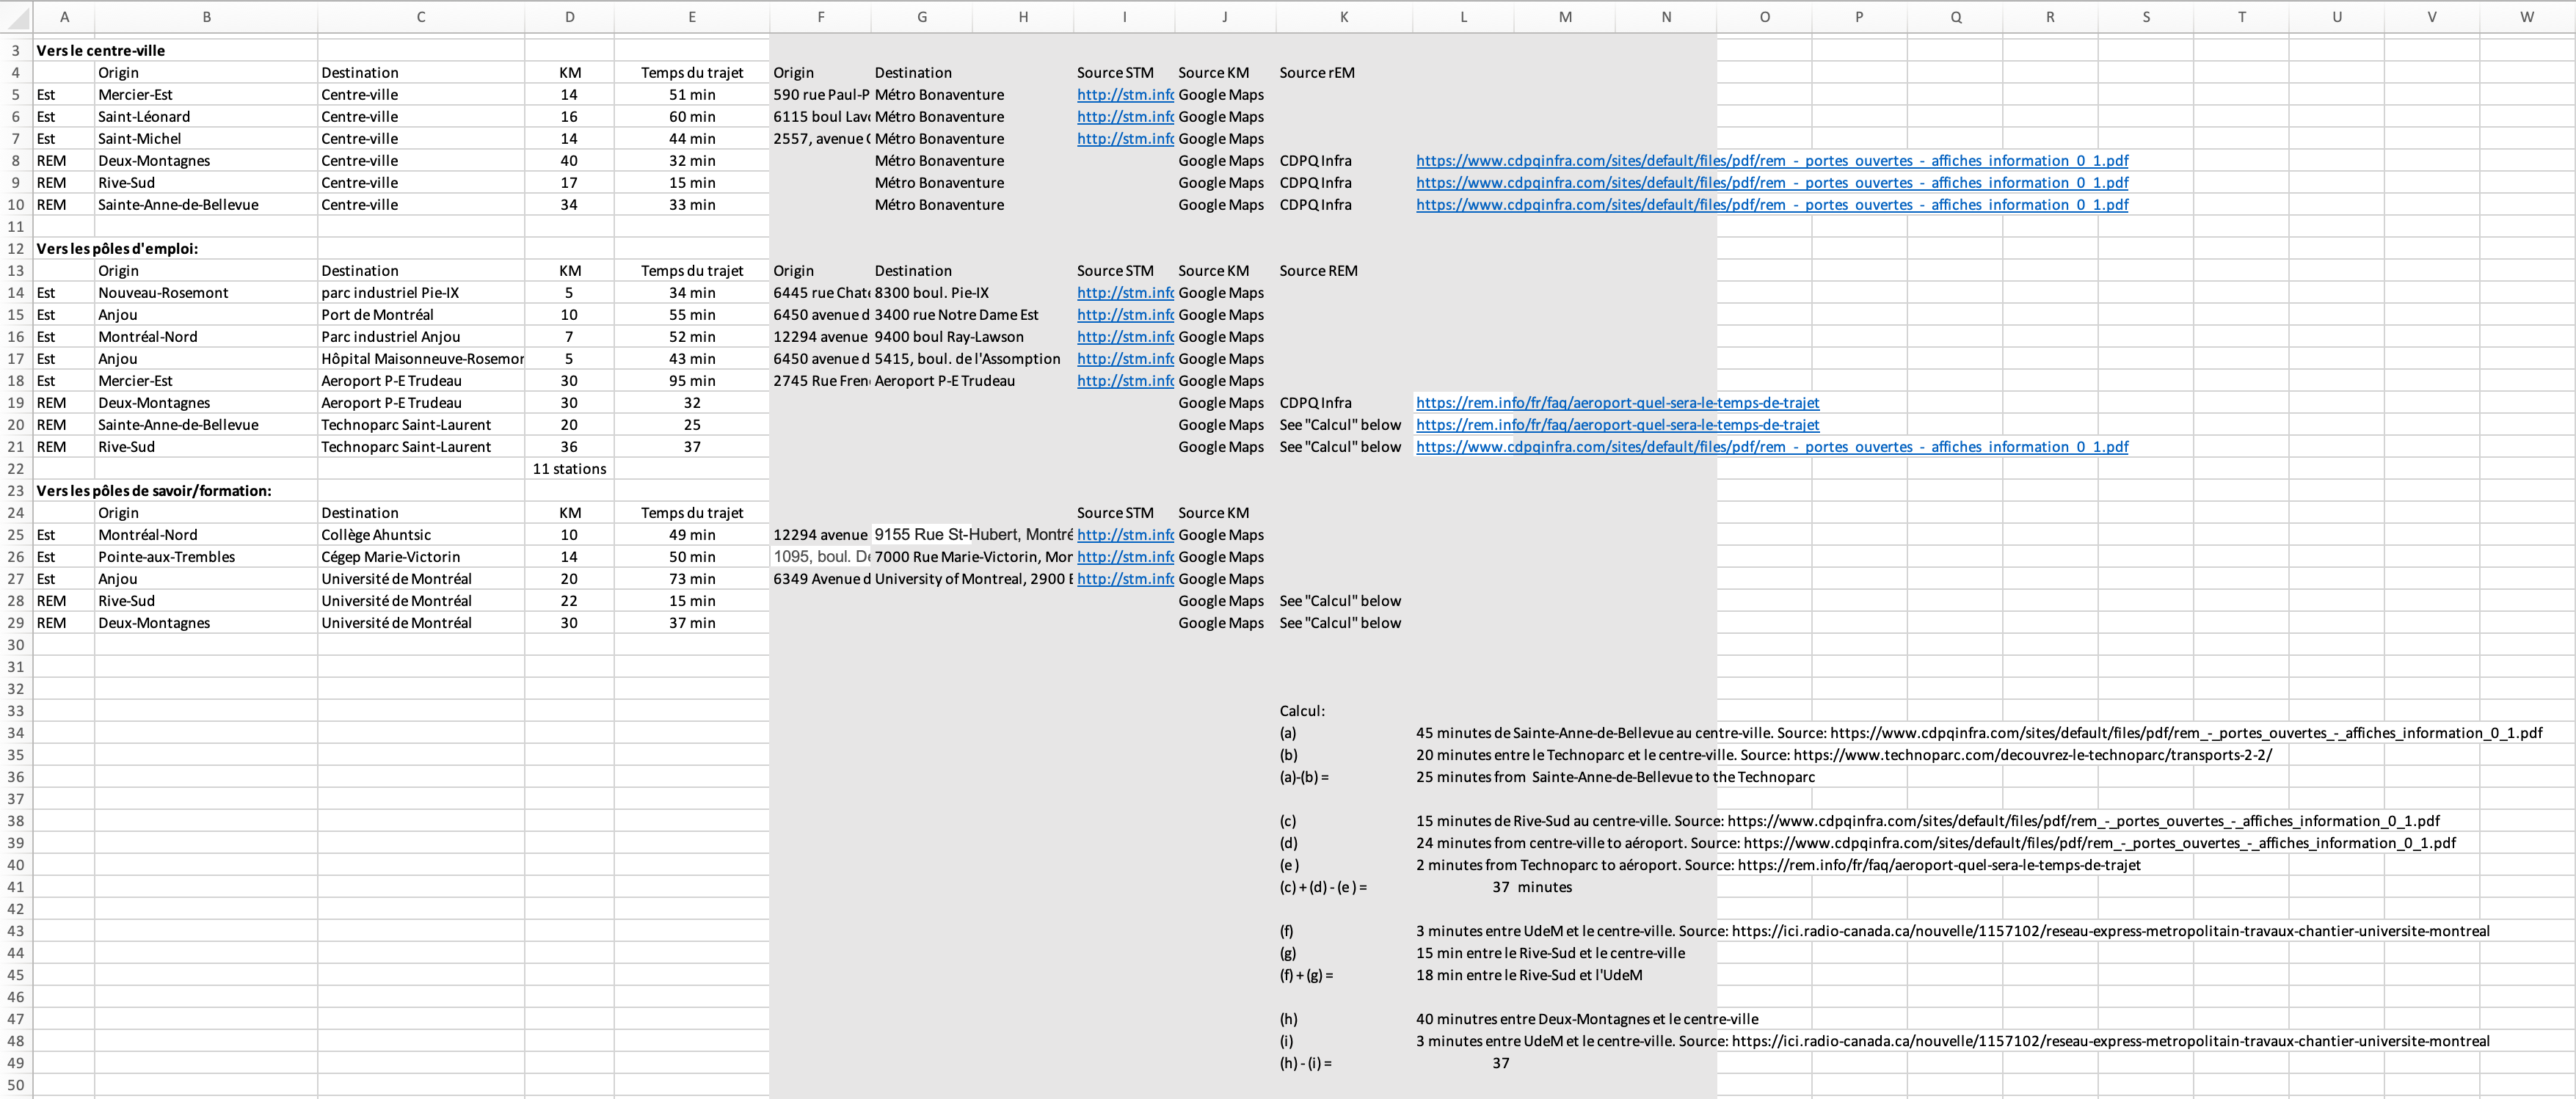
The development of the new réseau express métropolitain (REM) will increase the inequity between West and East of Montreal: it will be much more difficult to get to the city center, employment centers or poles of knowledge and training from the East because the means of transport will not be as developed, direct or efficient.
The idea that a trip is more or less long depending on the conditions finds its visual echo in a more or less winding route. A straight line represents the distance “as the crow flies” whereas a “winding route” shows those who have taken the time to reach their goal. We used this metaphor to represent the time it takes to travel each distance to common destinations, even if in some cases it is not so much detours as slower means of transport or impractical connections.
Before
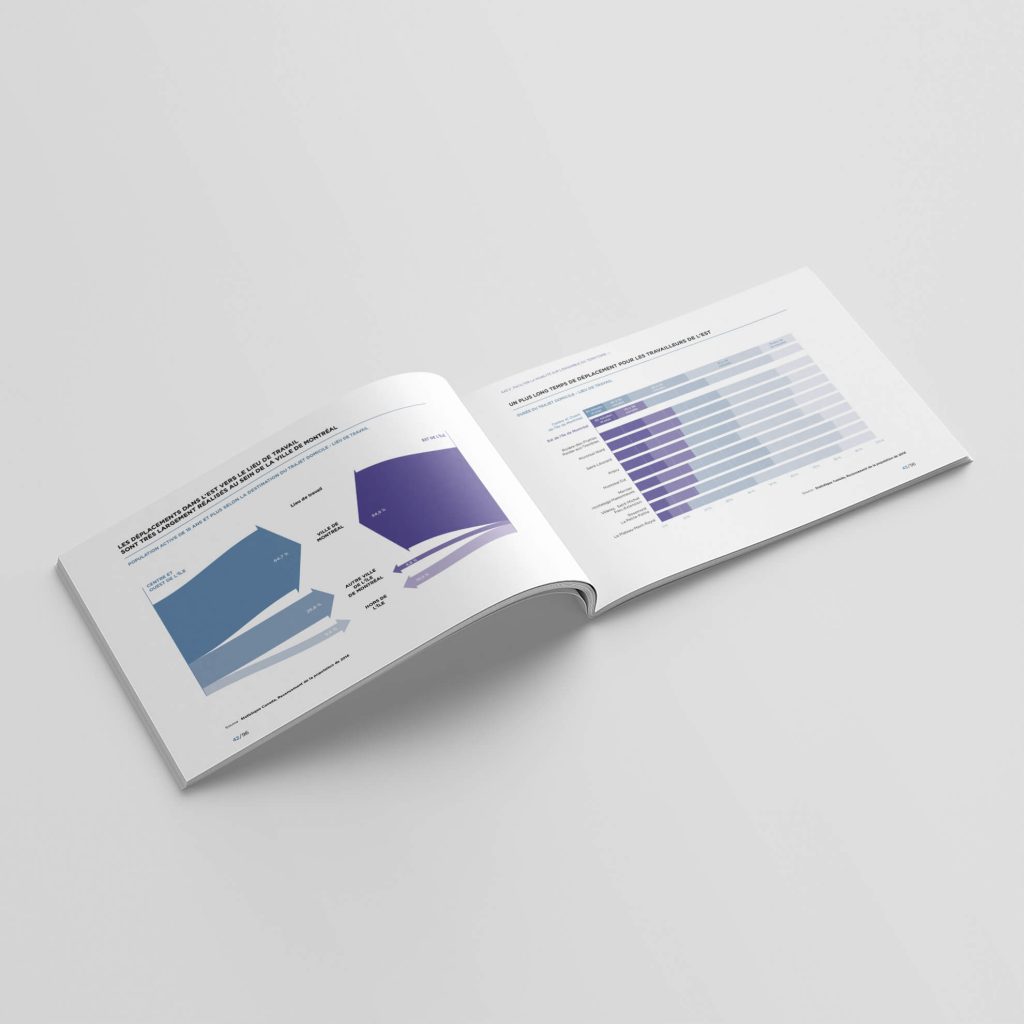
Where do residents from the East work?
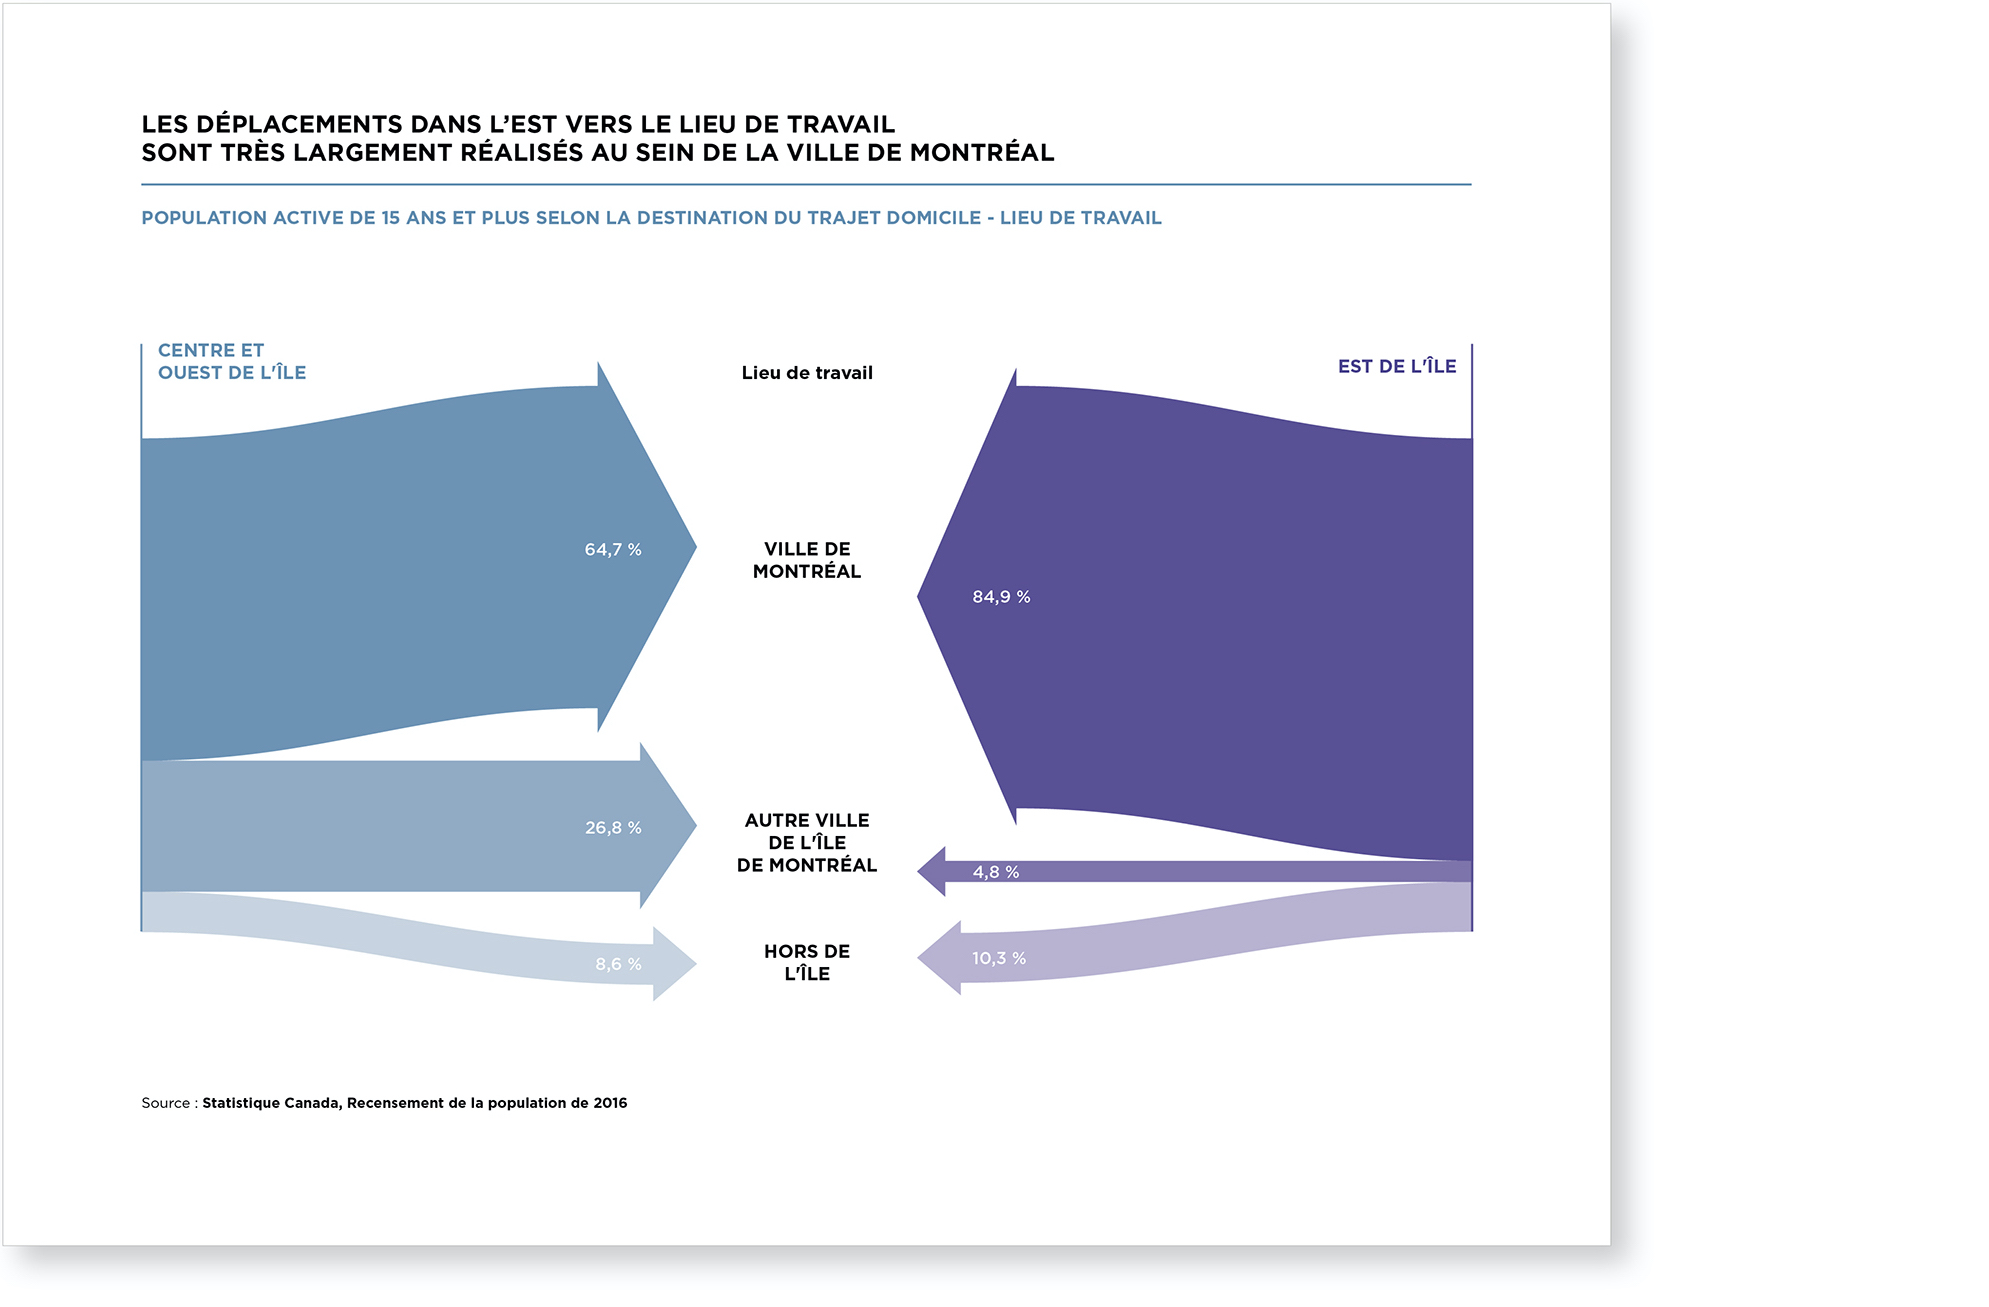
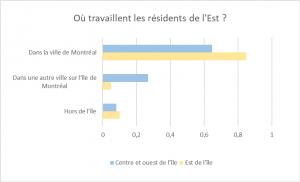
As we said above: residents of West Montreal will soon have access to a better transportation network that will allow them to reach their destination quickly, unlike the East of the city. Yet an overwhelming majority of eastern residents work in the city of Montreal.
In order to mark this deep gap between the different residents of the city, we have chosen to represent this information in the form of a Sankey diagram, which makes it possible to represent flows proportional to their value.
The result is obvious and visually impacting. The width of the arrows provides a better understanding of the importance of transport improvement issues for residents of the East.
Before
The automobile as a mode of transport in the East
The CCEM is disappointed by the lack of travel options offered to residents in the East. Indeed, most prefer to travel by automobile to go to their workplace. The resulting financial cost and congestion problems on the road do not help businesses in the East attract or retain employees.
This bar graph shows that too few people opt for public transport and that trips by bicycle or on foot are very rare for a large part of the population, and almost non-existent in certain areas. In addition, carpooling is rarely used.
Before
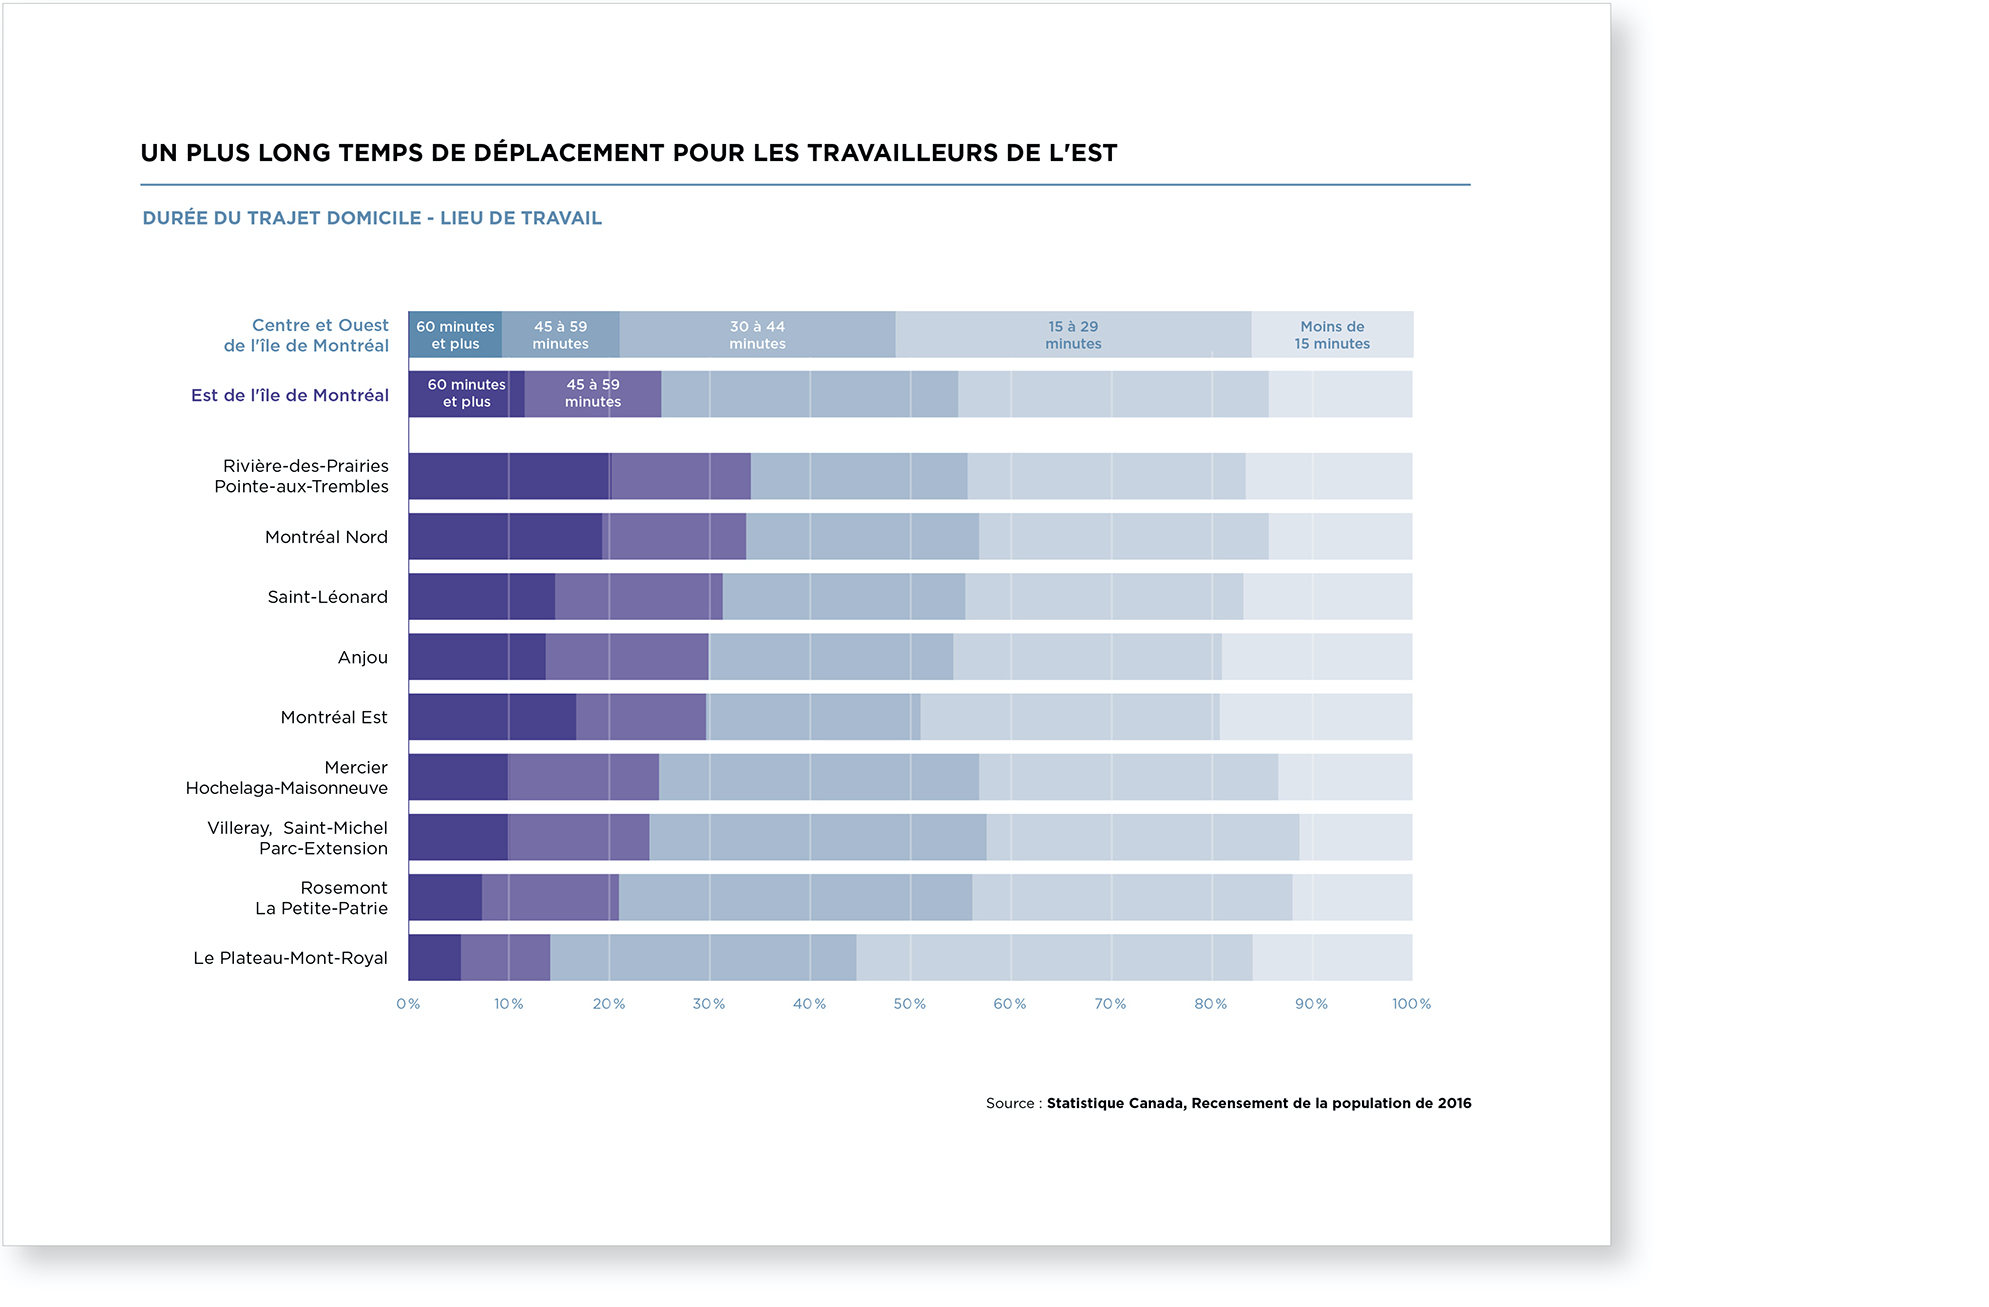
Longer travel times for workers in the East
Still on the subject of travel time, more workers in the East take over 45 minutes to get to work. In some boroughs, there may be a third of workers who have commutes that are just as long.
We kept the original concept of stacked bars, but made some adjustments.
The colors are ordered, like the data, from darkest (long) to lightest (short).
The emphasis is on trips of 45 minutes or more (purple) because this is the crux of the issue.
The two regional averages are slightly distinguished at the top of the graph.
The legend is integrated into the graph.
Before
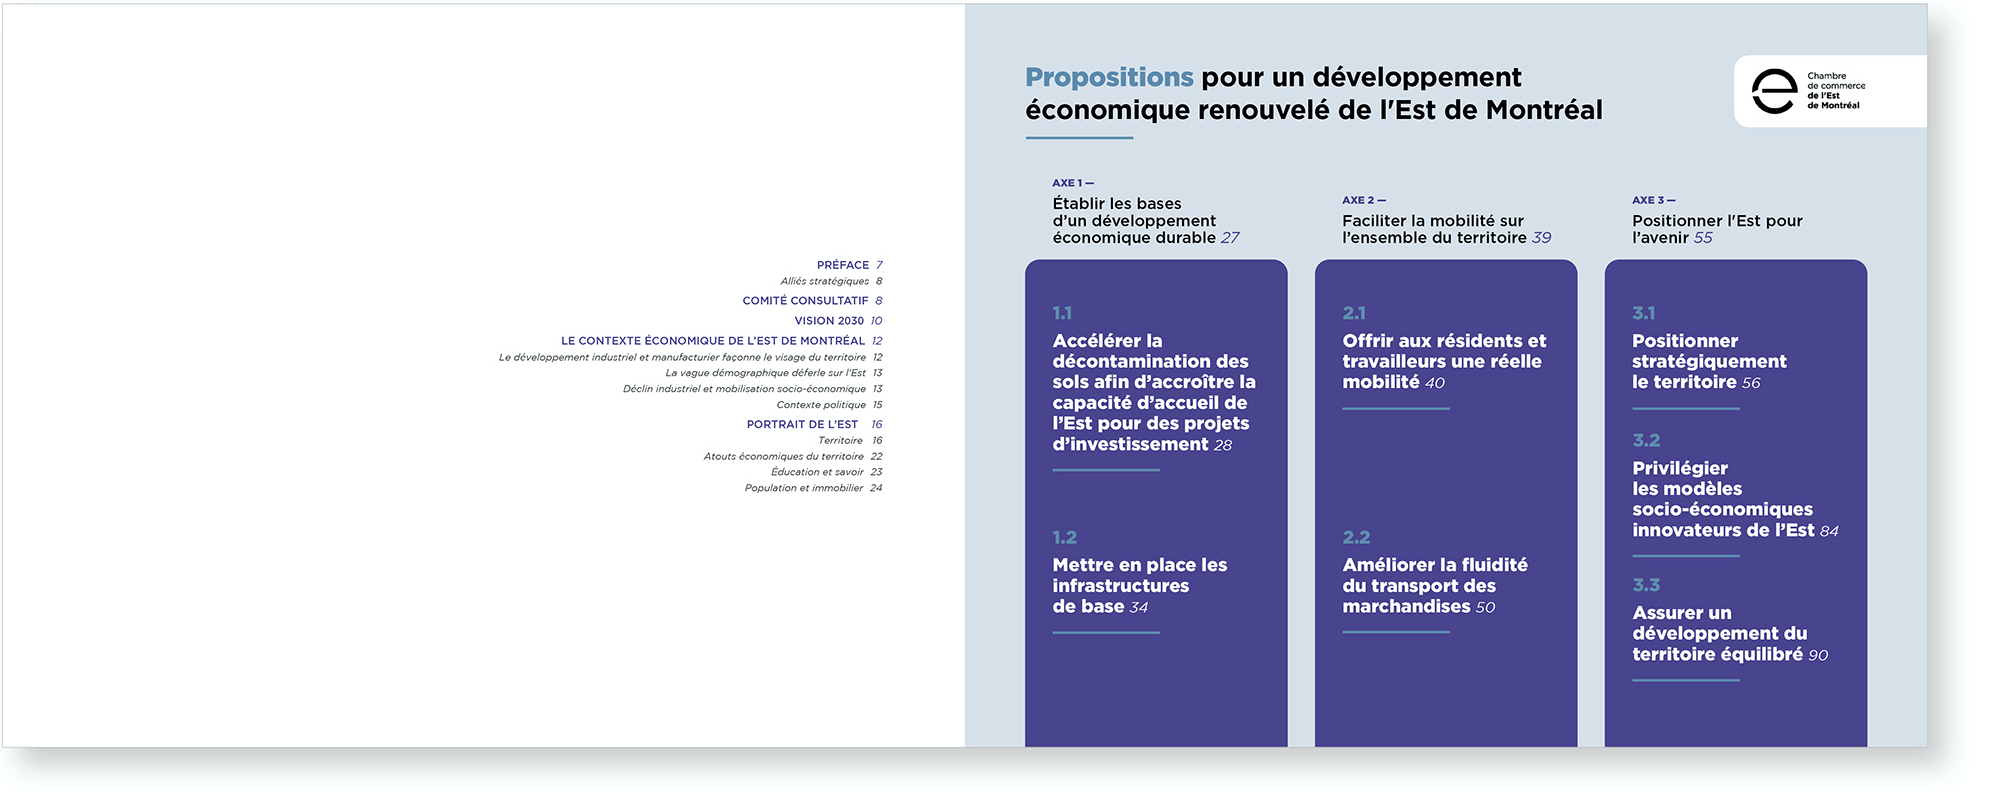
Table of contents
The white paper is built around proposals organized by topic. These proposals will be discussed repeatedly in meetings and presentations. They are a summary of the document.
We separated the table of contents into two parts, the first page covers the sections at the beginning of the document, then the recommendations in poster form are presented on the second.
The right-hand page can be used as a slide in an electronic presentation or even printed and displayed in the CCEM office, for visitors and staff.
We have added the logo in preparation for use outside the context of the full white paper.
Brochure version
The CCEM also wanted a very condensed version of its observations and recommendations for distribution at events with people who could be interested in the full report.
Instead of the small poster that had been suggested, we opted for a more portable leaflet which allowed us to structure the rest of the content while still keeping the poster from the list of recommendations as-is.