Behind the scenes: How we visualized gender inequality For International Women’s Day 2020, we published a series of seven charts (Facebook, Twitter, LinkedIn,… Read the complete story
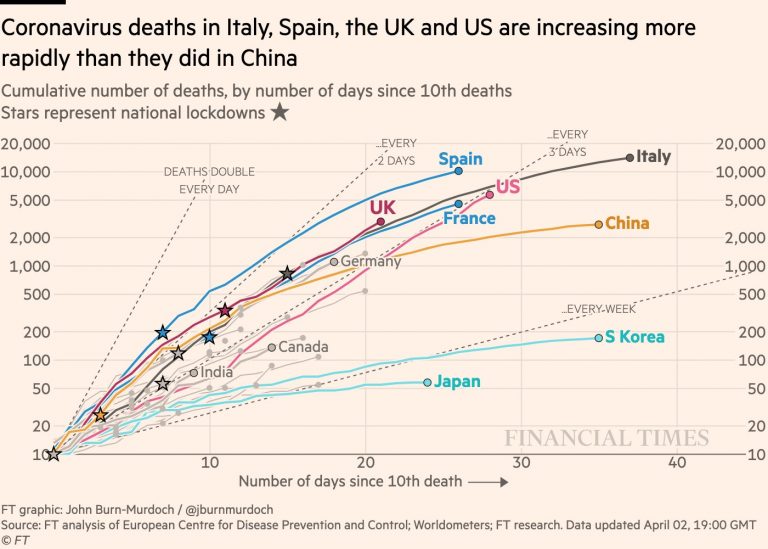
The best visualizations and charts (so far) to understand the coronavirus (COVID-19) Voilà: has not yet published a single chart about the COVID-19 pandemic yet, despite… Read the complete story