This report was designed for the Environment Global Practice of the World Bank Group. It’s a crucial topic as the wildlife population of the Western Congo Basin is declining and the region is in urgent need of solutions to reverse this trend.
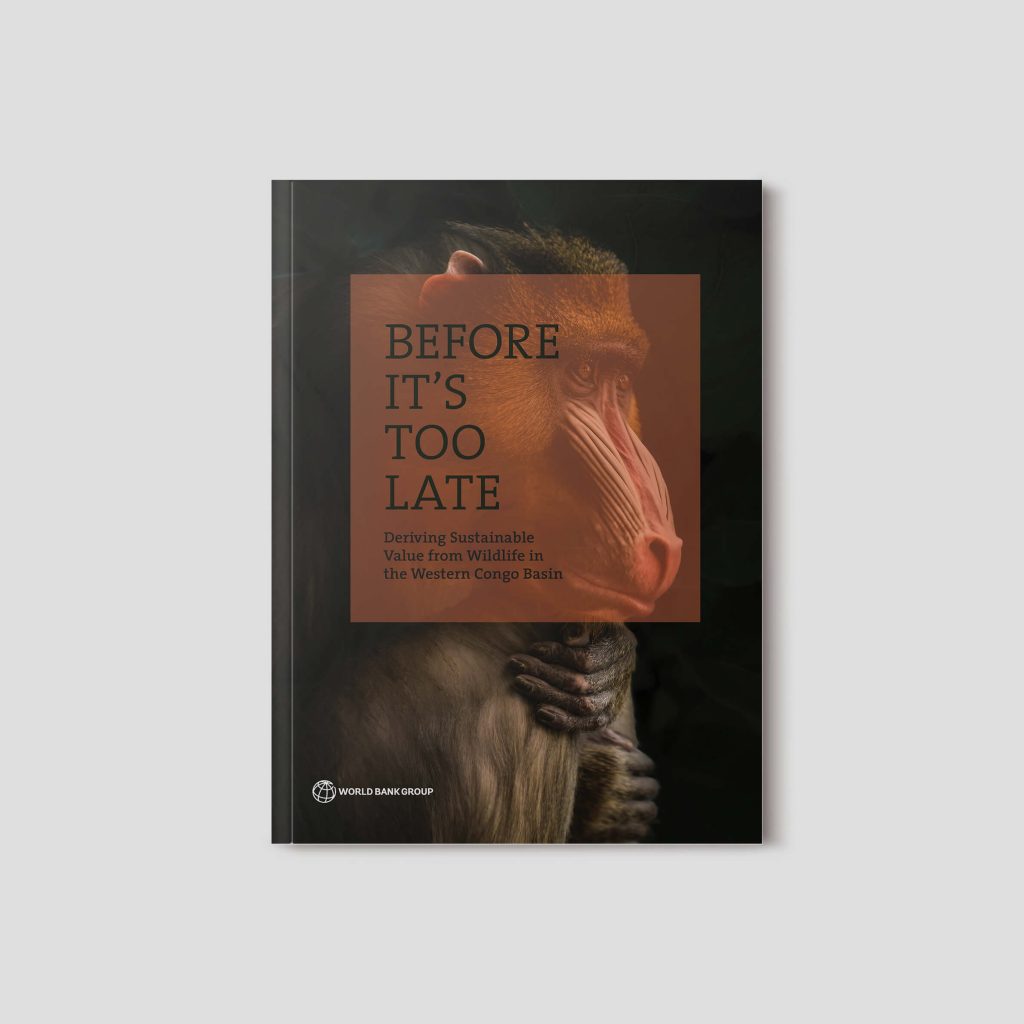
The cover page uses a stark image of a mandrill, an endangered species from the region. With its dark background and the pensive pose of the primate, the image conveys the seriousness of the situation, along with the natural beauty that is under threat. The picture was taken by Michael Steinberg at the Cleveland Zoo (USA) and found on Unsplash.
Chapter pages
The red square of the cover page is repeated as a reminder that these rare animals are targeted by poaching. In each of the image chosen, the focus is on the eyes of the animal. Each of them is among the species found in the Western Congo Basin.
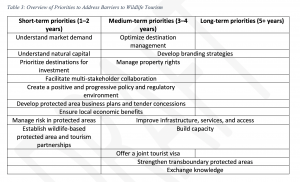
Redesigned tables
Table 3
Table 3 is an approximation of a timeline where priorities are placed according to the moment they would be best implemented.
The redesign helps to make that purpose more visible while aligning its look with the rest of the report.
Before
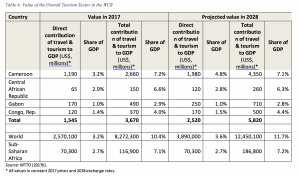
Table A.1
The objective of this table is to compare the value of certain economic activities in 2017 to their projected value in 2028. The organization of the original table makes that difficult because the data is grouped by year.
In the redesign, we have reorganized the columns to allow for direct comparison of the values between the two years.
Before
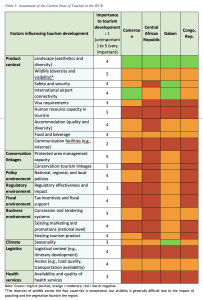
Table A.2
This heat map is meant to help the reader assess the current state of tourism in the four countries of the Western Congo Basin. The green cells mean that the country is in a good position. The red cells mean that the situation needs to be greatly improved.
The redesign improves on the basic principle by putting the factors in order of importance under each category so that the reader can immediately see if the most important ones are in good shape. This order is supported by a heat map in a neutral color (grey) that does not interfere visually with the main heatmap.
Before
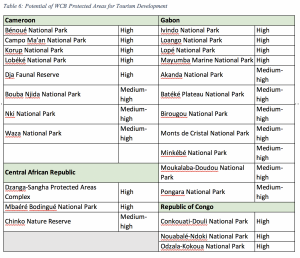
Table A.3
This table conveys the potential for tourism development of different protected areas in four countries.
The redesign makes this more visible by differentiating the areas that have a high potential. The reader can quickly distinguish the countries with several areas from those where many of these areas have a high potential.