I got to cross an item off the bucket list when offered the opportunity to work with another data visualization professional. Luck stroke when a client invited me to work on a project with Stephanie Evergreen. And it was all that I was hoping: inspiring, professional, dynamic.
Just look at what she’s done: she’s written one of the books in my library, she delivers workshops around the world, blogs profusely, is cooking up a dataviz academy, and more. She’s been on the PolicyViz podcast of course. But now is when she really achieves fame by agreeing to answer a few questions for this blog.
1. Of the last 50 tweets in your home timeline, which is your favorite and why?
My friend Chris Lysy posted a cartoon and short blog about the drama I recently had in which some pure statisticians got angry over the way guests on my site worded their regression results. It’s adding humor to something that became a little stressful and I always appreciate that.
Today’s post inspired by @evergreendata‘s guest post by William Faulkner, João Martinho, and Heather Muntzer > https://t.co/PD0tH0TY1z #eval pic.twitter.com/8FpUnLnnwM
— Chris Lysy (@clysy) April 7, 2017
2. What’s the one thing you would improve on the Minard map?
A “Translate This” button, because I don’t know French.
3. Who needs data visualization most and doesn’t know it?
The guy sitting next to me in first class. I tweeted a pic of one of these situations:
This guy’s presentation is going to suuuuuuck. #firstclass @AmericanAir pic.twitter.com/SoY7j1qLUv
— Stephanie Evergreen (@evergreendata) January 26, 2017
4. If you were to organize a conference on data visualization, how would you call it and why?
I’d call it the “Free Kittens Conference” and make it such that everyone sends the one person they know who really needs to learn more about data visualization but is reluctant to change. Do you think the guy in first class will come to a Free Kittens Conference? Maybe it needs to be called Free Martinis.
5. What else would you do if you were not remotely in this field?
Nature guide. I have a knack for identifying flora and fauna. I can barely remember my mother’s birthday but I can detail how to distinguish a vulture from a hawk from an eagle when they fly overhead (hint: it’s in the wing tips).
6. How would you introduce yourself to Edward Tufte?
Hard pass on this question, Francis.
7. Who has less than 300 followers on Twitter and should have much more?
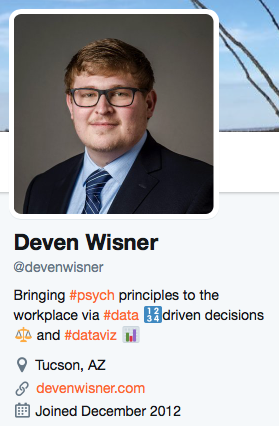
Deven Wisner. He’s been blogging on dataviz lately and he’s got solid info to share.
8. (From Andy Kirk) What’s the one data visualisation passion project that you’ve never had the time, opportunity or capability to undertake but would dearly love to do so one day?
After launching the Data Viz Academy and the Chart Chooser Cards, I’ve gotten to realize many of my dreams. But I’ve always wanted to work with a client who would let me build a 30 foot data visualization out of clay, showcasing some great results, for display in their lobby.
9. What question should I ask my next guest?
What’s the freshest good data visualization idea you’ve heard lately?
Francis Gagnon is an information designer and the founder of Voilà: (2013), a data visualization agency specialized in sustainable development.


