Dans le domaine de la visualisation de données, nous avons souvent affaire à des abstractions chiffrées.
Mais lorsque l’Institut climatique du Canada nous a sollicités pour visualiser ses recherches sur les infrastructures, un sujet bien concret, nous avons vu le potentiel de créer des illustrations.
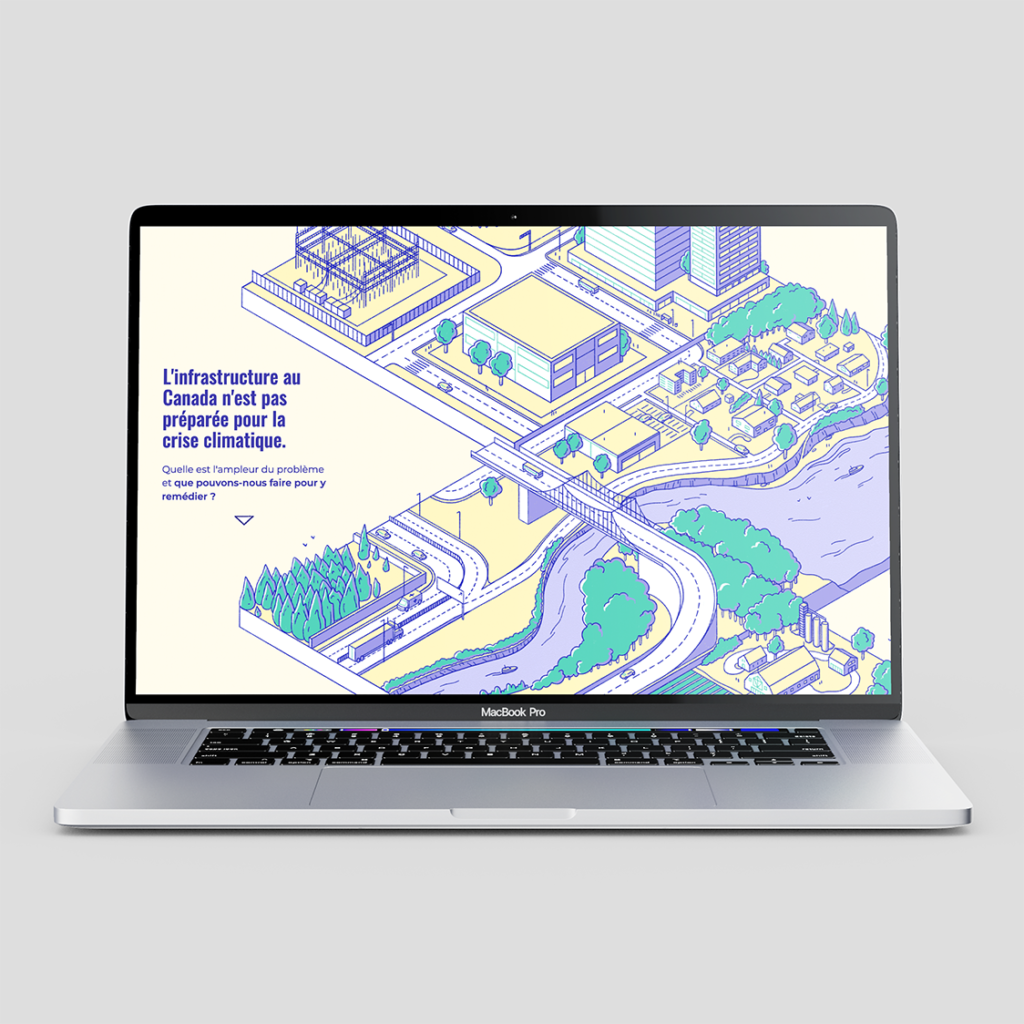
Voici donc l’histoire de la transformation de données sur les coûts du changement climatique en une ambitieuse narration interactive aux paysages animés.
Les données sont plus que des chiffres
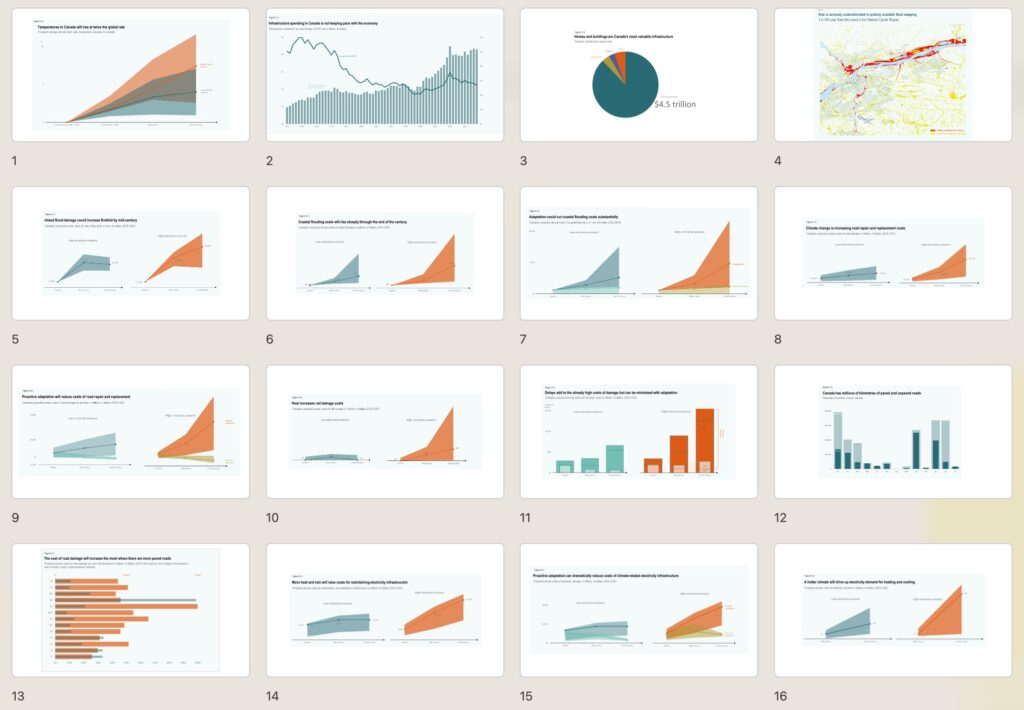
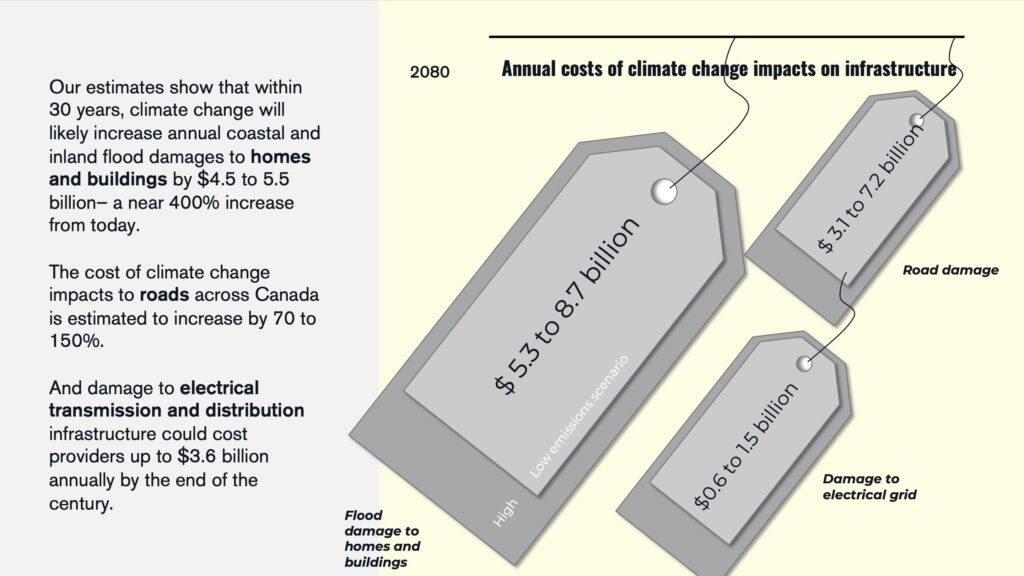
Voici le genre de graphiques que le client avait préparé. Ils montrent des calculs, des conclusions et des recommandations.
Exacts, clairs, précis.
Mais aussi génériques, sans lien visuel avec le sujet du monde réel auquel ils se rapportent.
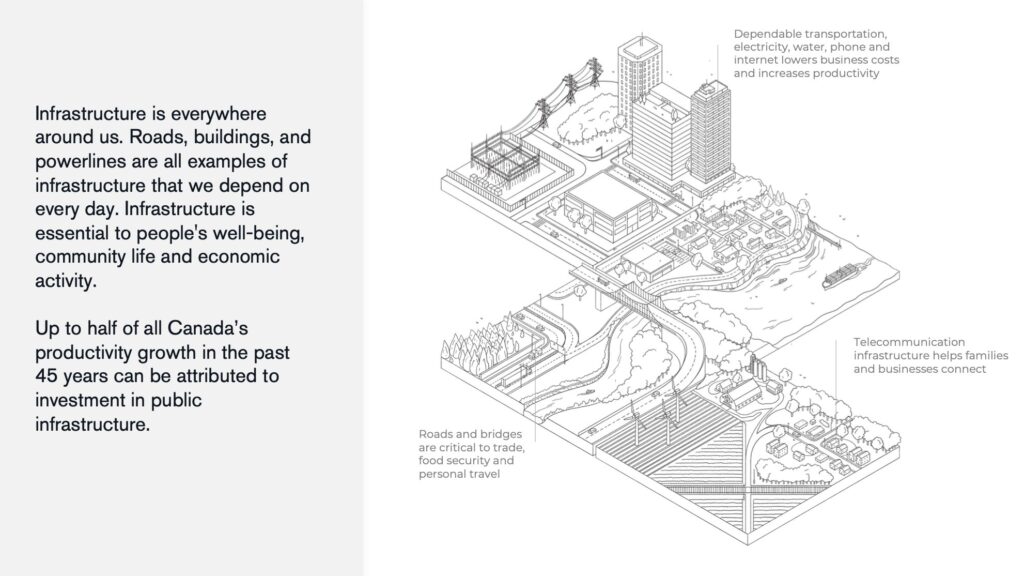
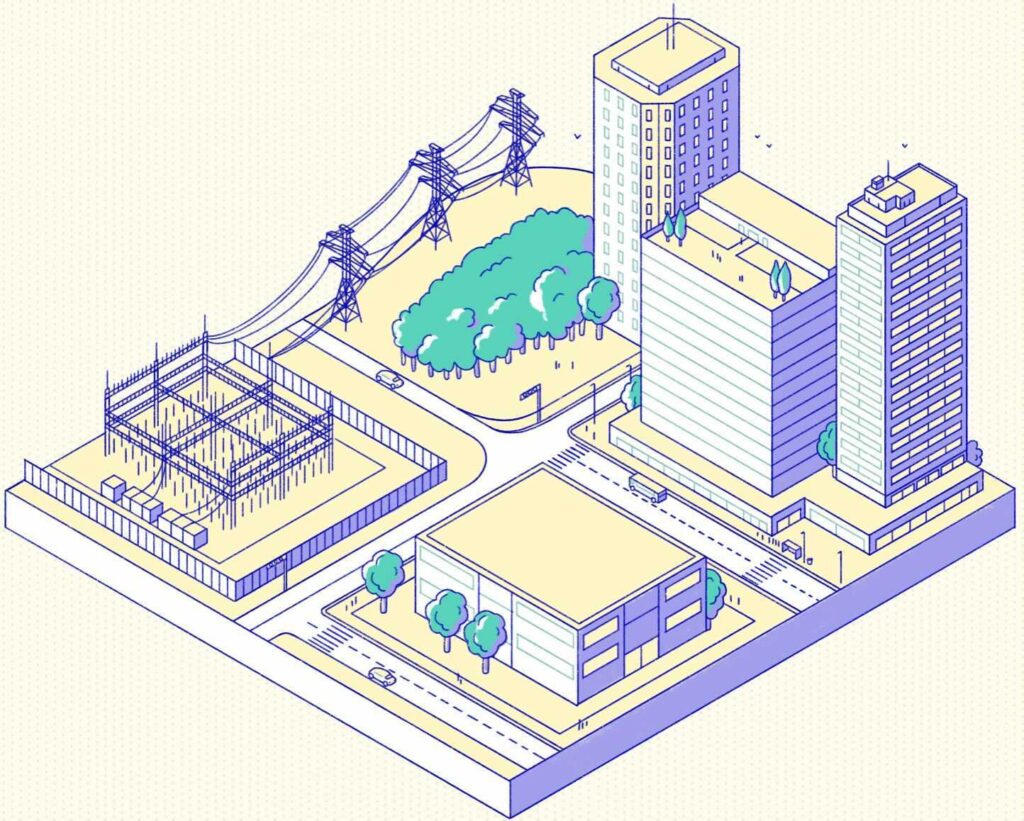
Pour saisir cette opportunité, nous avons donc développé des images qui décrivent plus concrètement ces infrastructures.
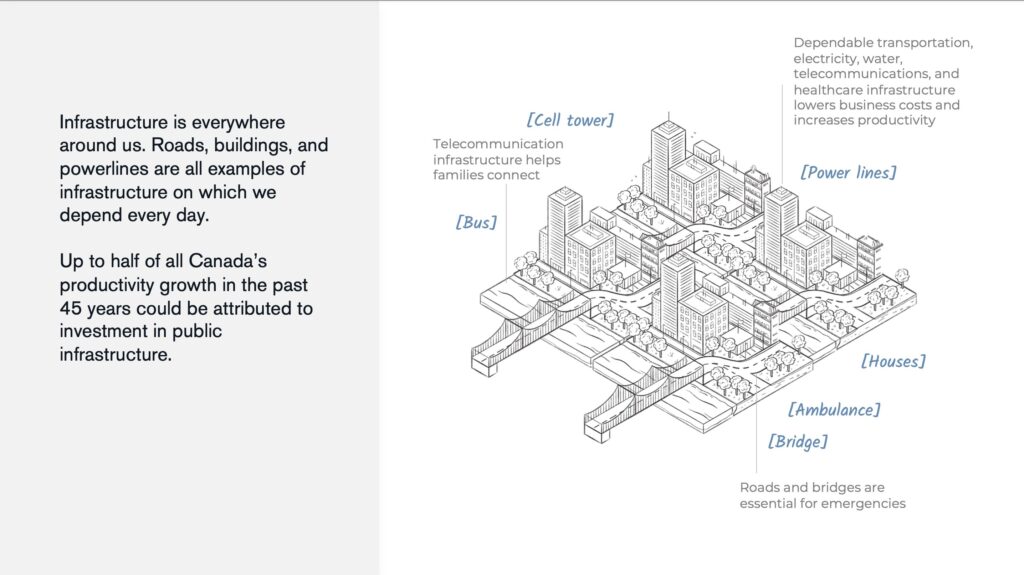
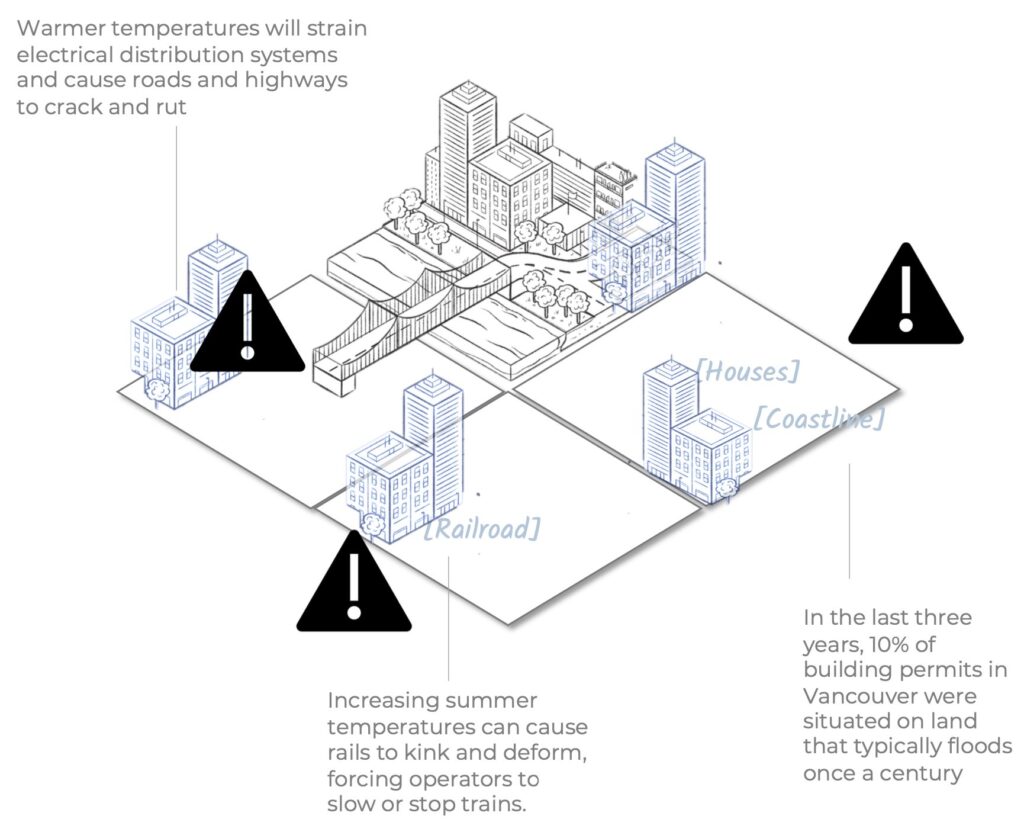
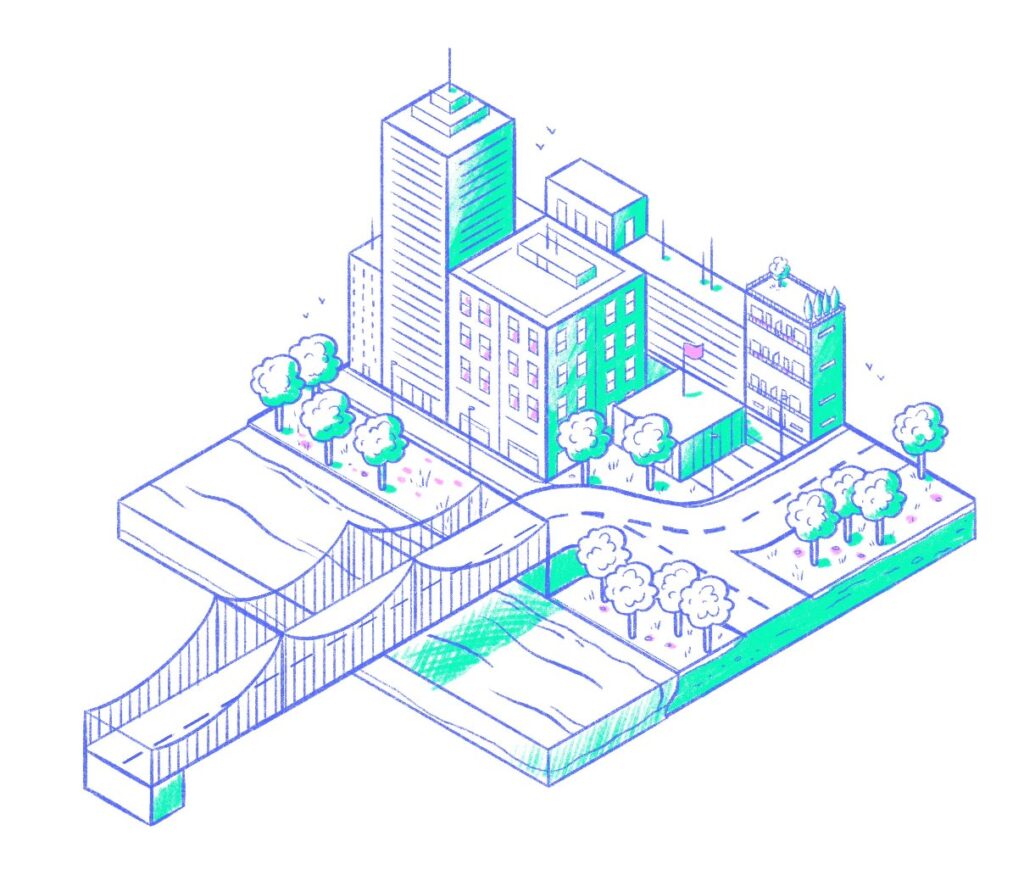
Le tout premier concept que nous avons présenté était une illustration d’un paysage urbain en perspective isométrique. Le client a tout de suite vu le potentiel du visuel et l’a accepté.
Le mérite lui revient donc d’avoir su se projeter car nous n’avions qu’une seule petite illustration pour présenter toutes les combinaisons d’infrastructures. Comme notre illustratrice était partie en vacances, nous avons dû réutiliser cette seule image à plusieurs reprises!
Nous avions également quelques idées de visuels concernant certains chiffres spécifiques, mais ces croquis n’ont pas dépassé le premier concept (et nous les avons réutilisés un an plus tard pour un autre projet).
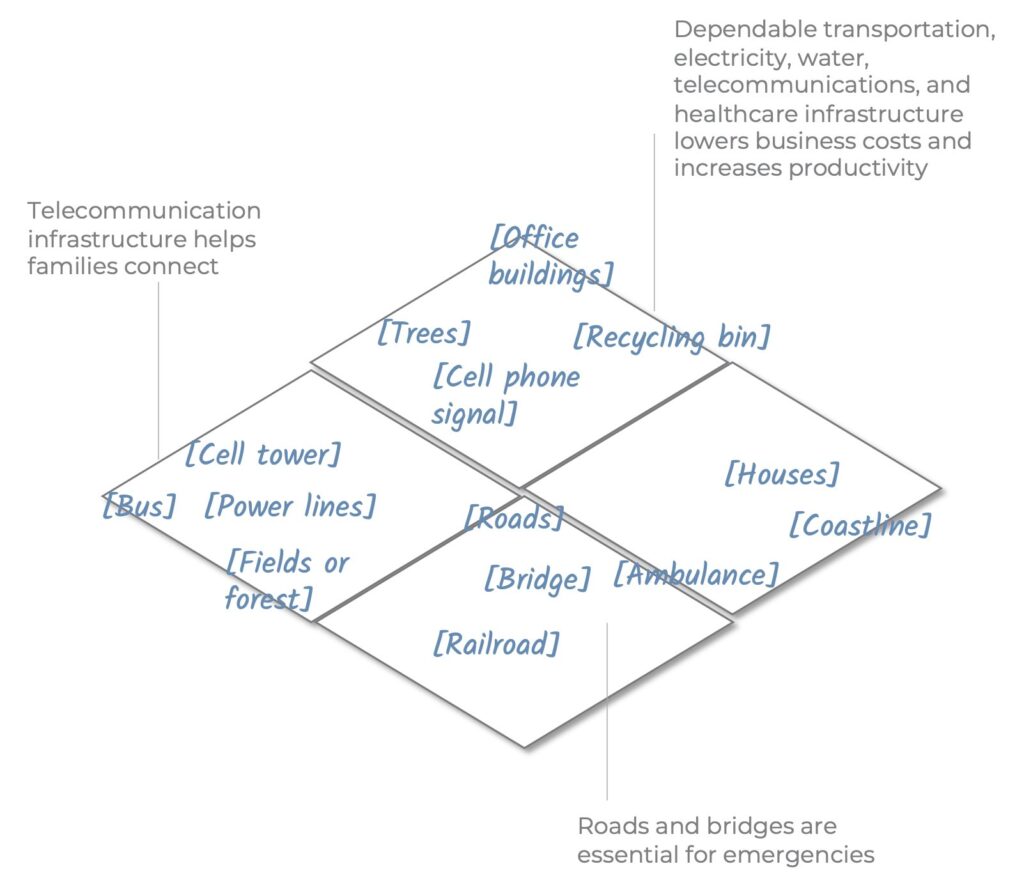
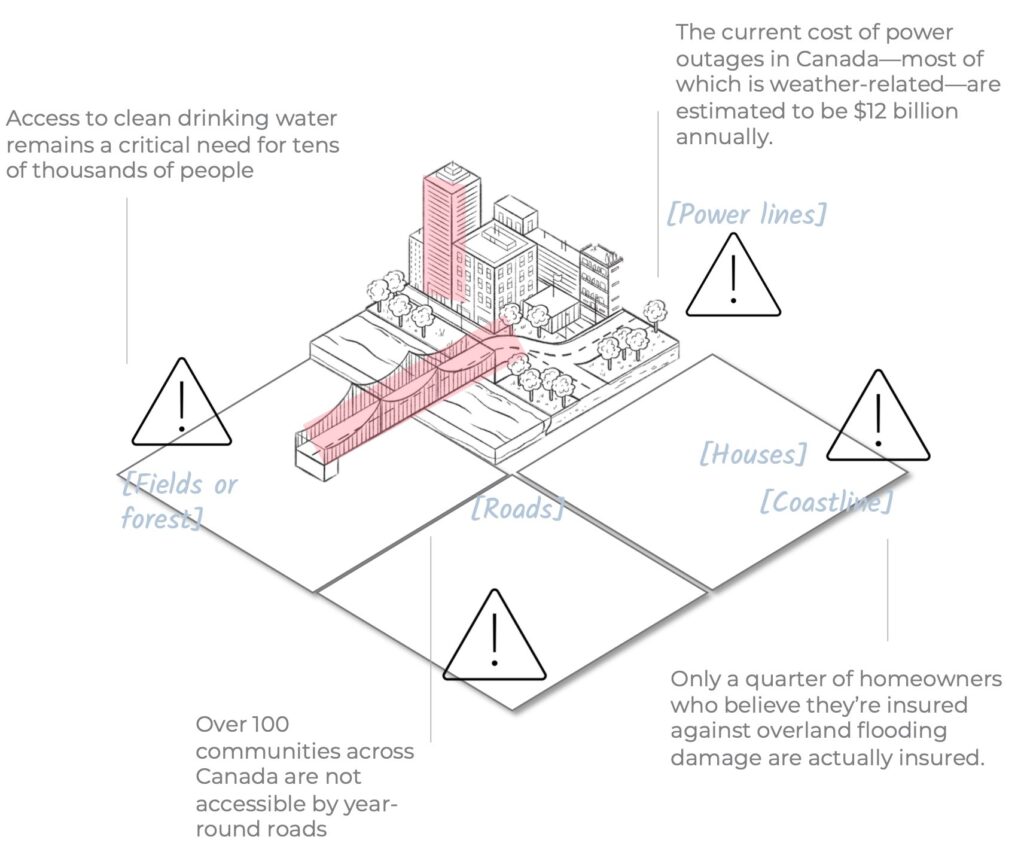
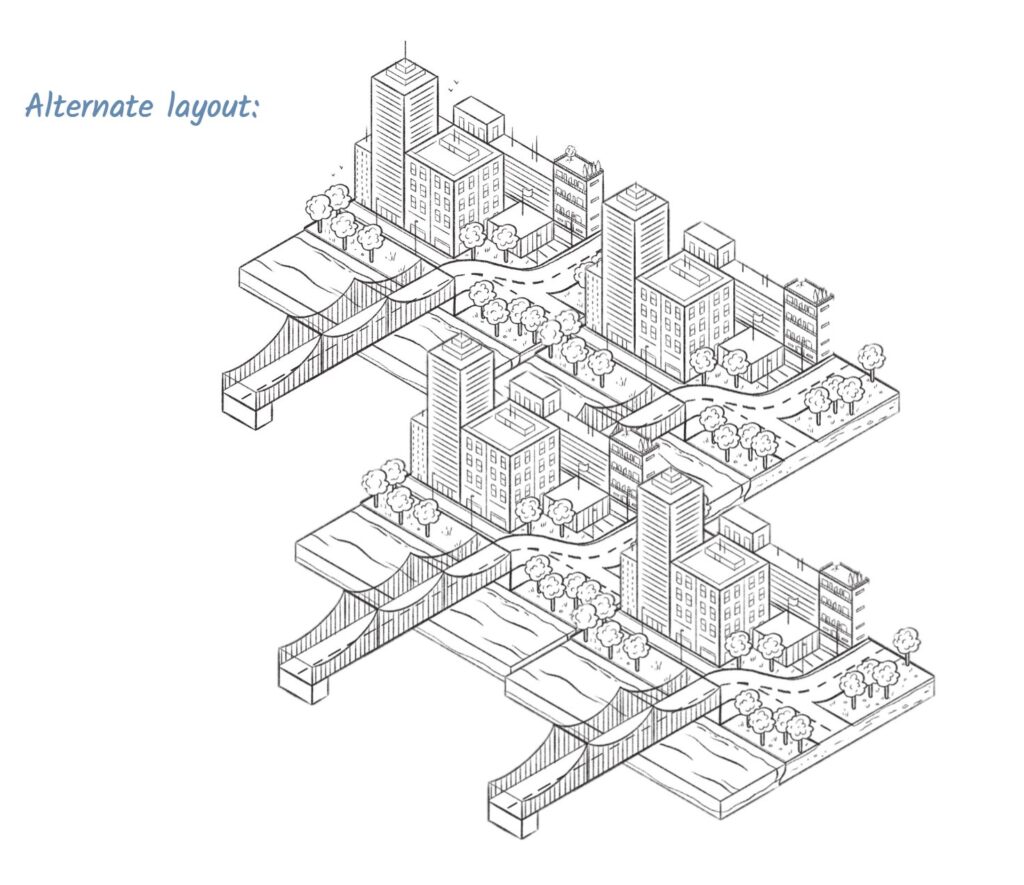
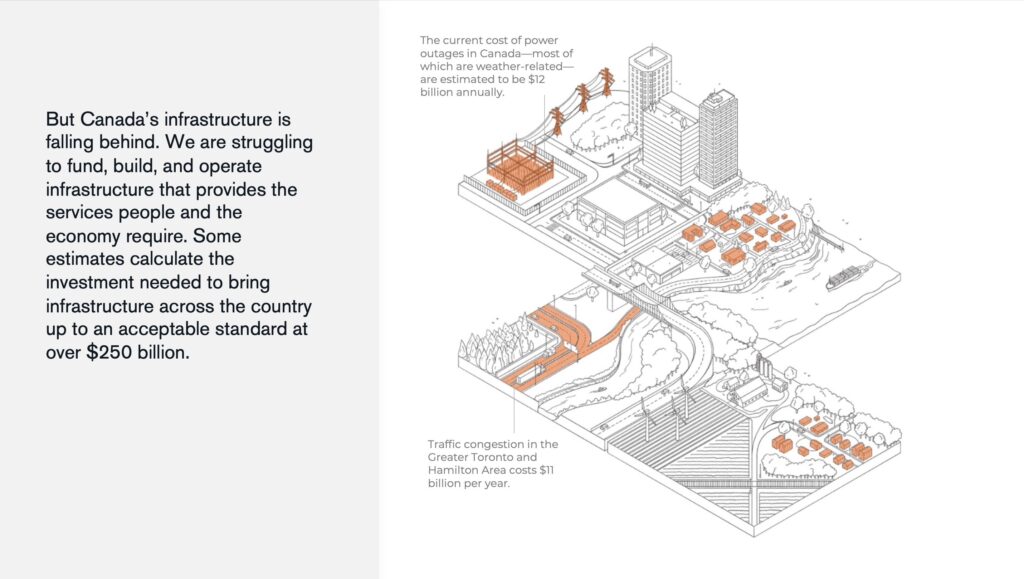
Sur la base de l’approbation du concept par le client, nous avons développé l’illustration isométrique complète sur quatre panneaux associés à quatre types d’environnements différents (milieu urbain, côte maritime, trafic routier et campagne agricole). La disposition en zigzag nous a laissé de l’espace pour y ajouter des annotations et a rendu le visuel plus dynamique que si nous avions agencé les panneaux en une matrice carrée.
Raconter une histoire
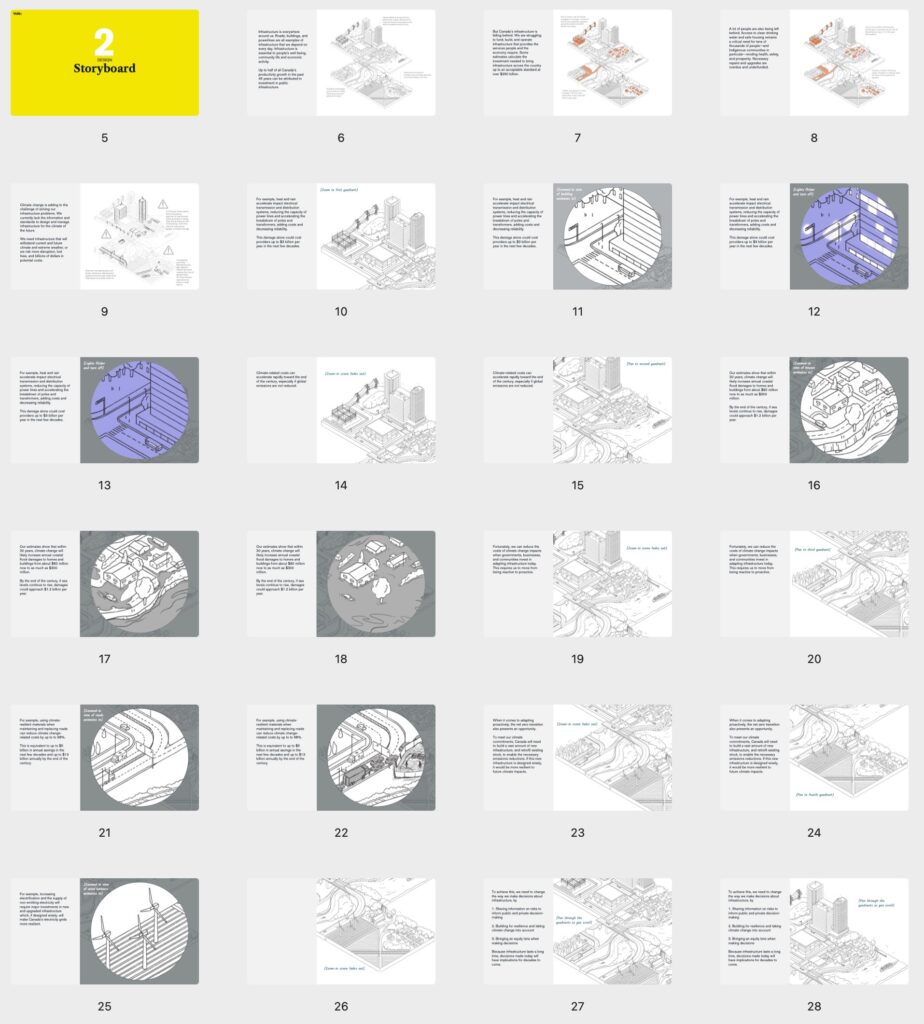
Nous avons ensuite discuté avec le client de la narration exacte de l’interactif et adapté tous les visuels au complet en fonction de ses besoins.
C’est un travail considérable qui est souvent négligé dans la conception de l’information, y compris par les clients qui supposent que leur histoire est déjà prête à être visualisée.
Nous avons également introduit un important outil de narration: l’utilisation de la couleur pour attirer l’attention des lecteurs sur plusieurs impacts des changements climatiques dans le paysage.
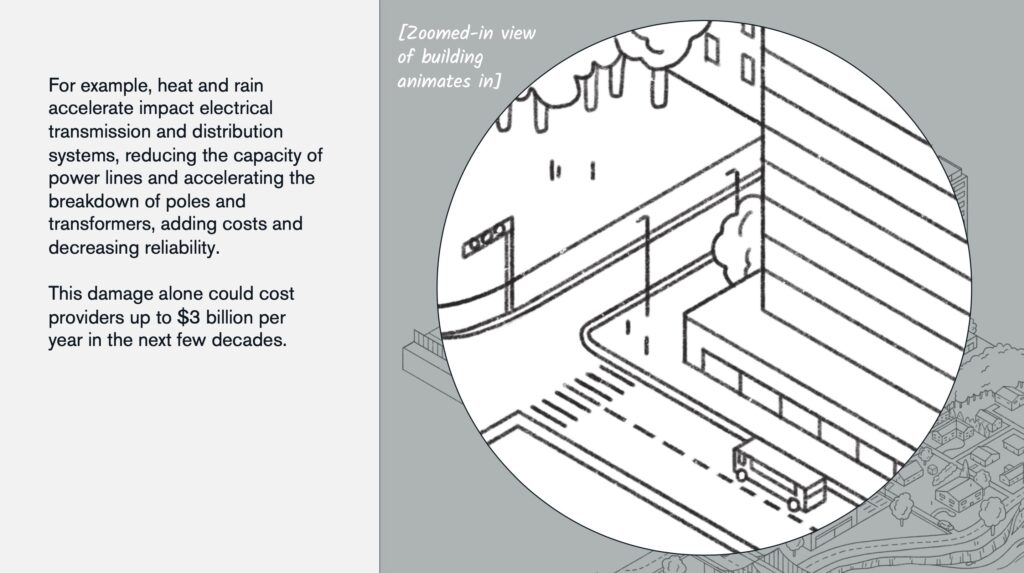
Le zoom, autre idée développée à ce stade, nous a parfois permis de concentrer l’attention sur une partie de l’histoire.
Leçon retenue: c’est une chose de l’imaginer, mais c’en est une autre de l’implémenter en code par la suite!
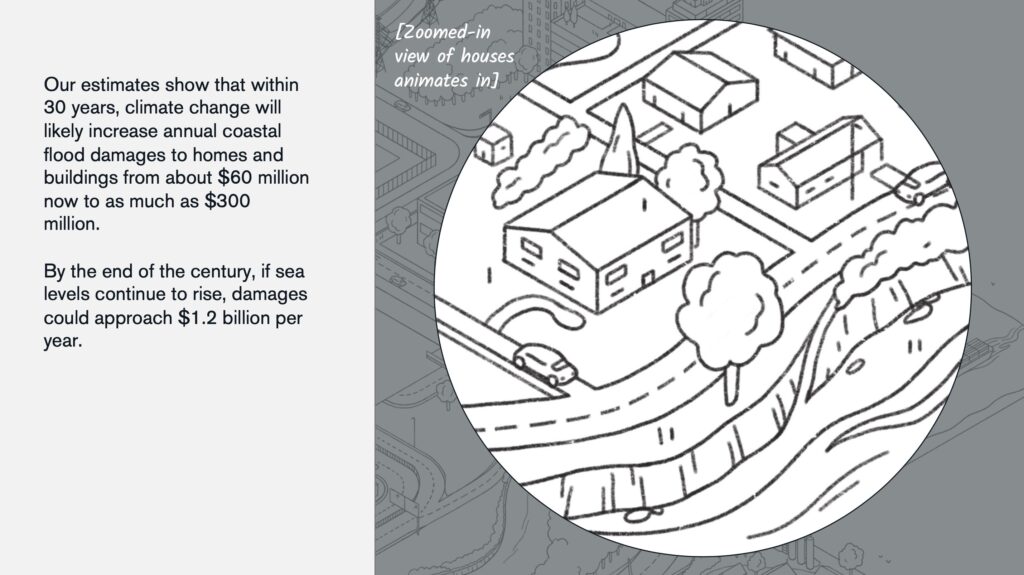
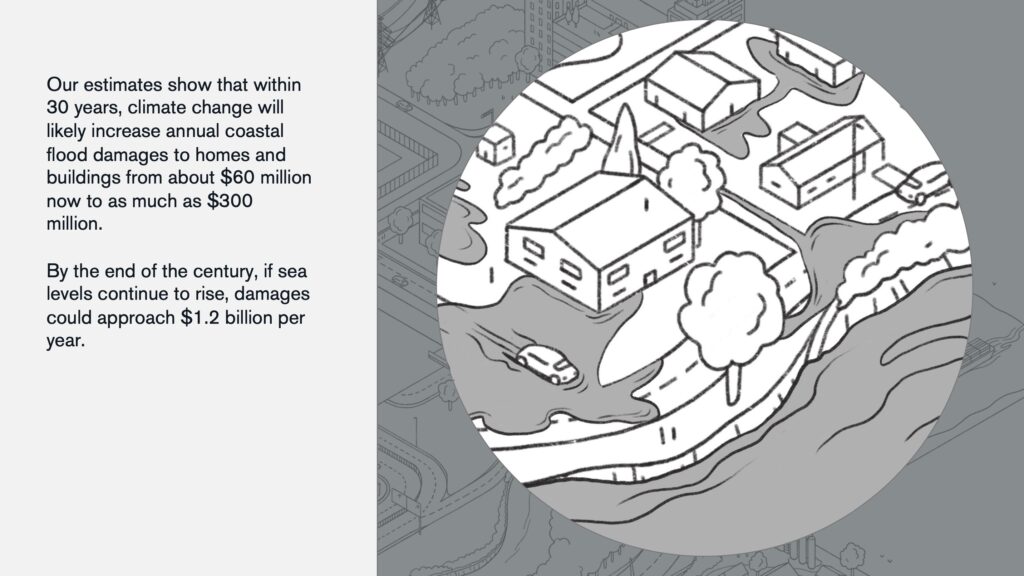
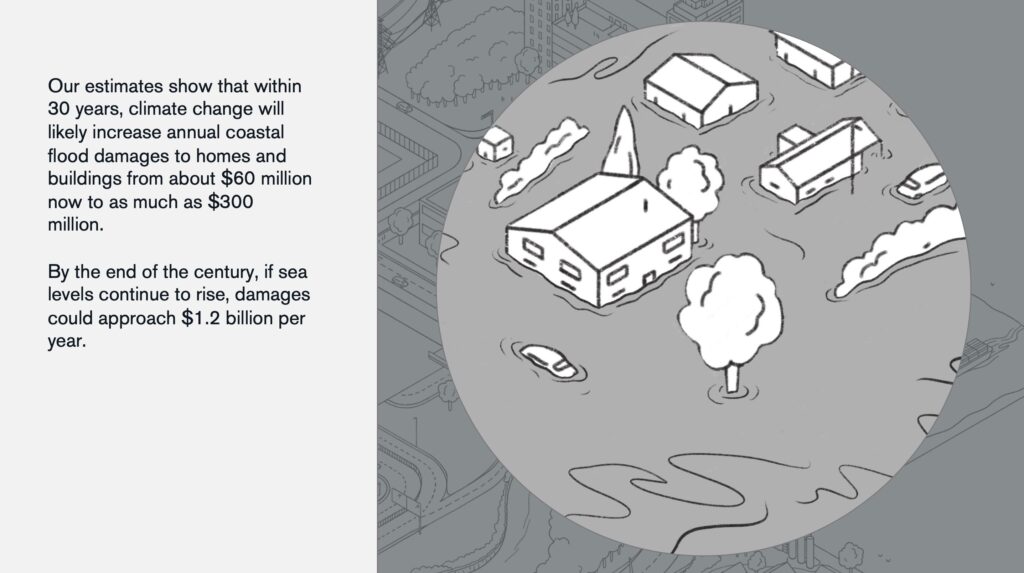
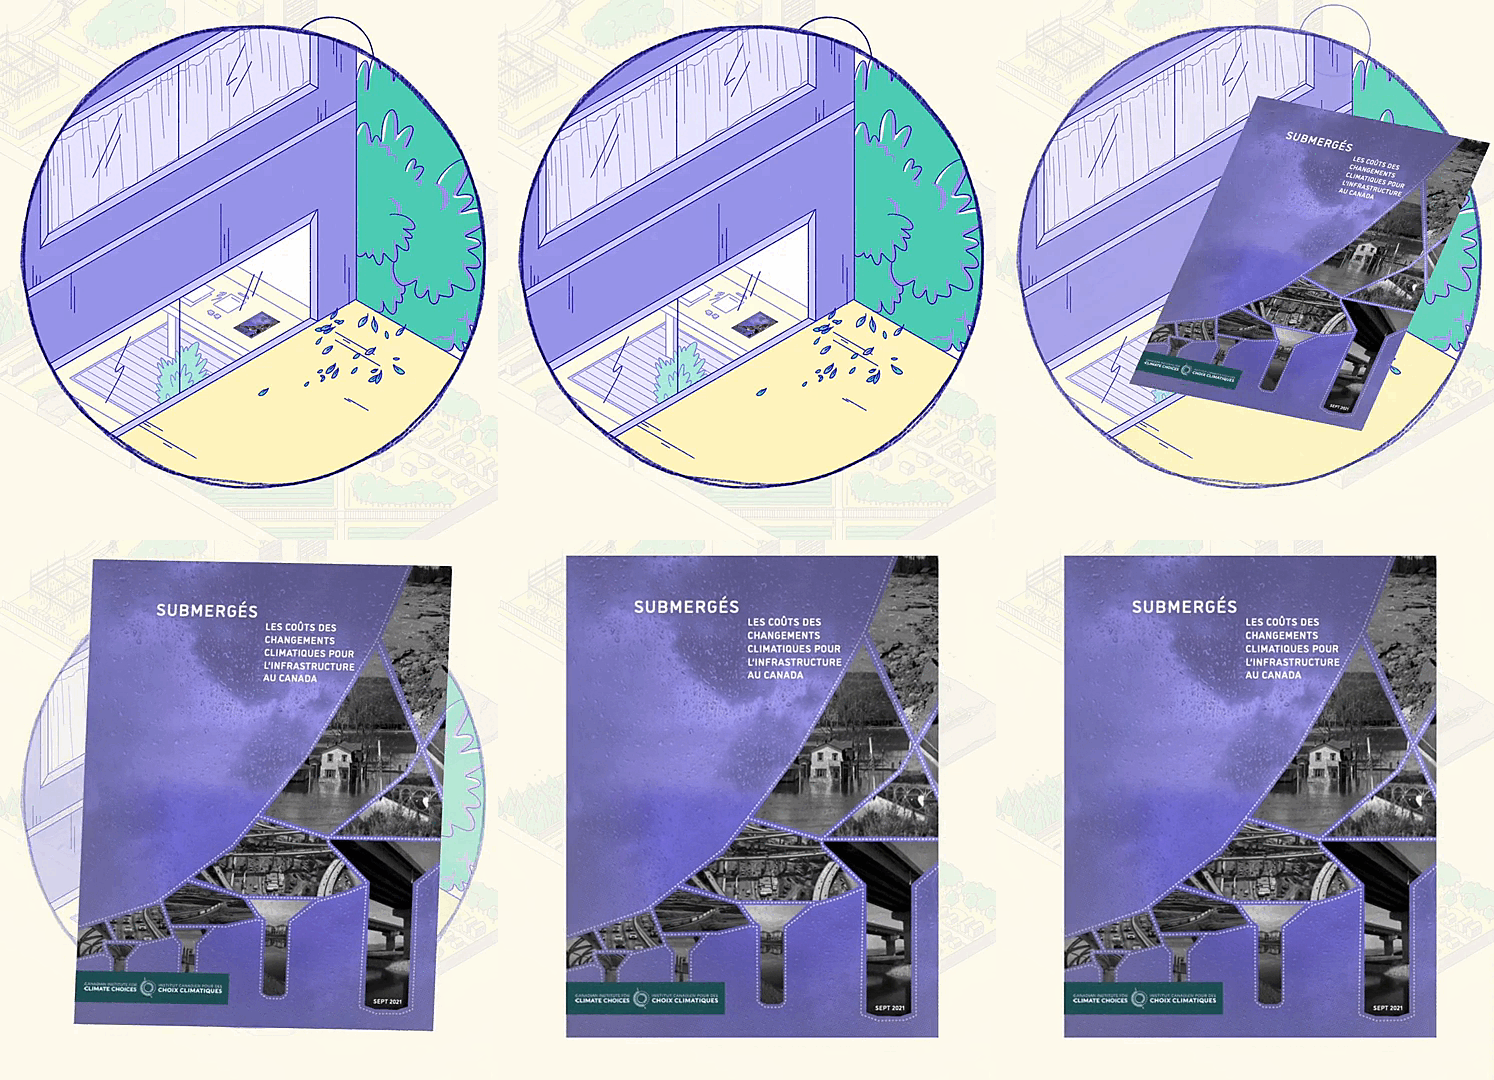
Certaines animations ont même été développées pour n’être visibles qu’à l’intérieur des cercles zoomés. Dans cet exemple, la première scène montre une partie de la côte maritime, la seconde représente une montée des eaux partielles et enfin, la troisième illustre le résultat d’une inondation complète.
Pousser l’esthétique
Nous avons décidé de ne pas opter pour une palette colorée réaliste, mais plutôt pour un nuancier simplifié et abstrait. Cela nous a permis de respecter les couleurs de la marque du client.
Voici notre premier essai et la palette finale.
Conclusion:
✅ Concept
✅ Narration
✅ Esthétique
Tout était en place pour la phase de codage, qui a aussi été une belle opportunité pour raffiner le design dans son ensemble. Bien sûr, il y a eu beaucoup de débogage… et quelques intégrations web.
Voici un détail que j’aime beaucoup: le rapport lui-même est caché dans le paysage tout du long de la narration et est révélé à la fin.
Le changement climatique aura des répercussions sur l’électricité, les maisons et les bâtiments, les routes et les chemins de fer. Les chiffres contenus dans ce rapport concernent les Canadien·nes, mais les conclusions qu’il contient peuvent inspirer toutes les nations qui doivent s’adapter à ce nouveau climat. Ce rapport est important.
Voici le lien du portfolio vers la présentation de cet interactif sur les coûts du changement climatique. Faites défiler la page jusqu’en bas pour voir la narration complète.
Et voici la version Behance (l’équipe apprécie les « Appréciations » sur cette plateforme!)
Francis Gagnon est designer d'information et le fondateur de Voilà: (2013), une agence de visualisation de données spécialisée dans le développement durable.
