



Establish government-wide data visualization standards
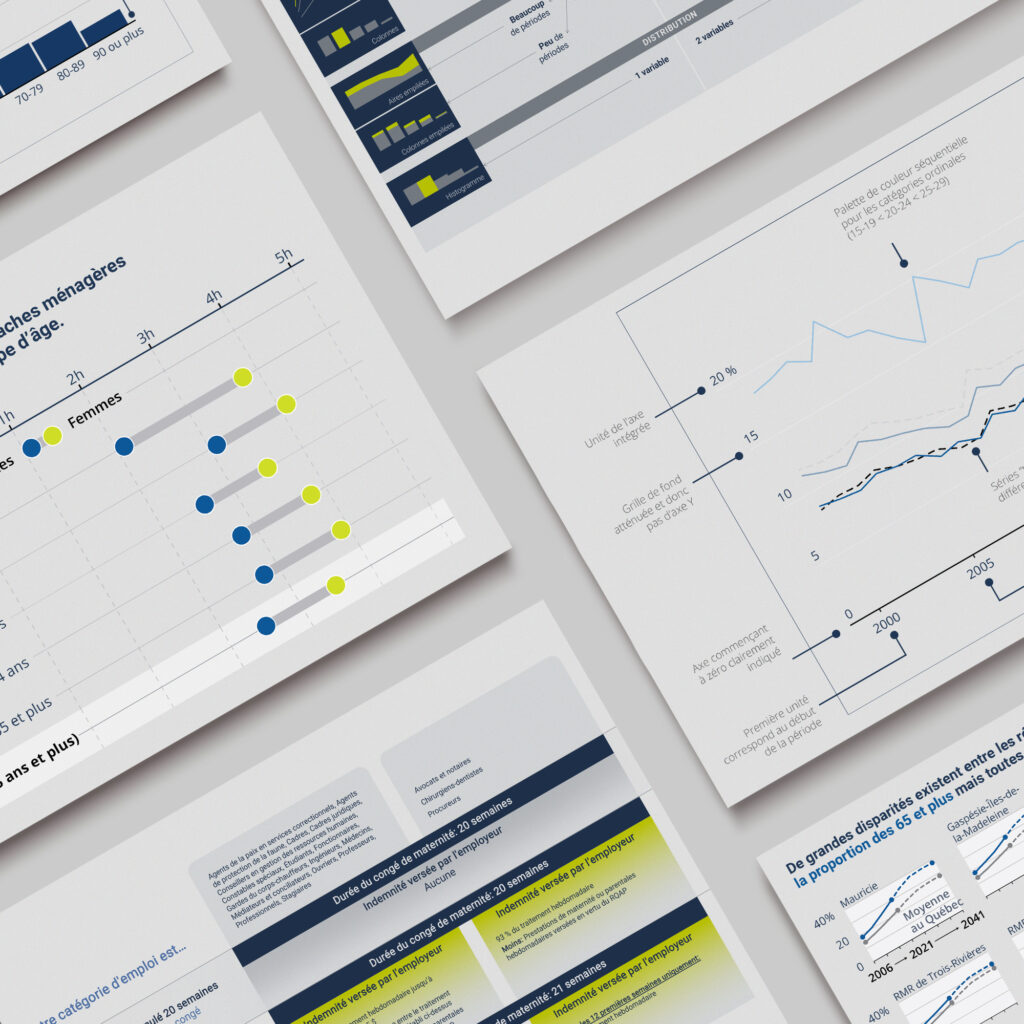
Establish government-wide data visualization standards The Gouvernement of Quebec asked Voilà: to create a data visualization style guide to equip the whole Québec.ca’s website with a common visualization language. The result? Greater clarity and accessibility of the information shared with the general public Created to be useful The style guide is structured by function and includes […]
Standards for climate charts
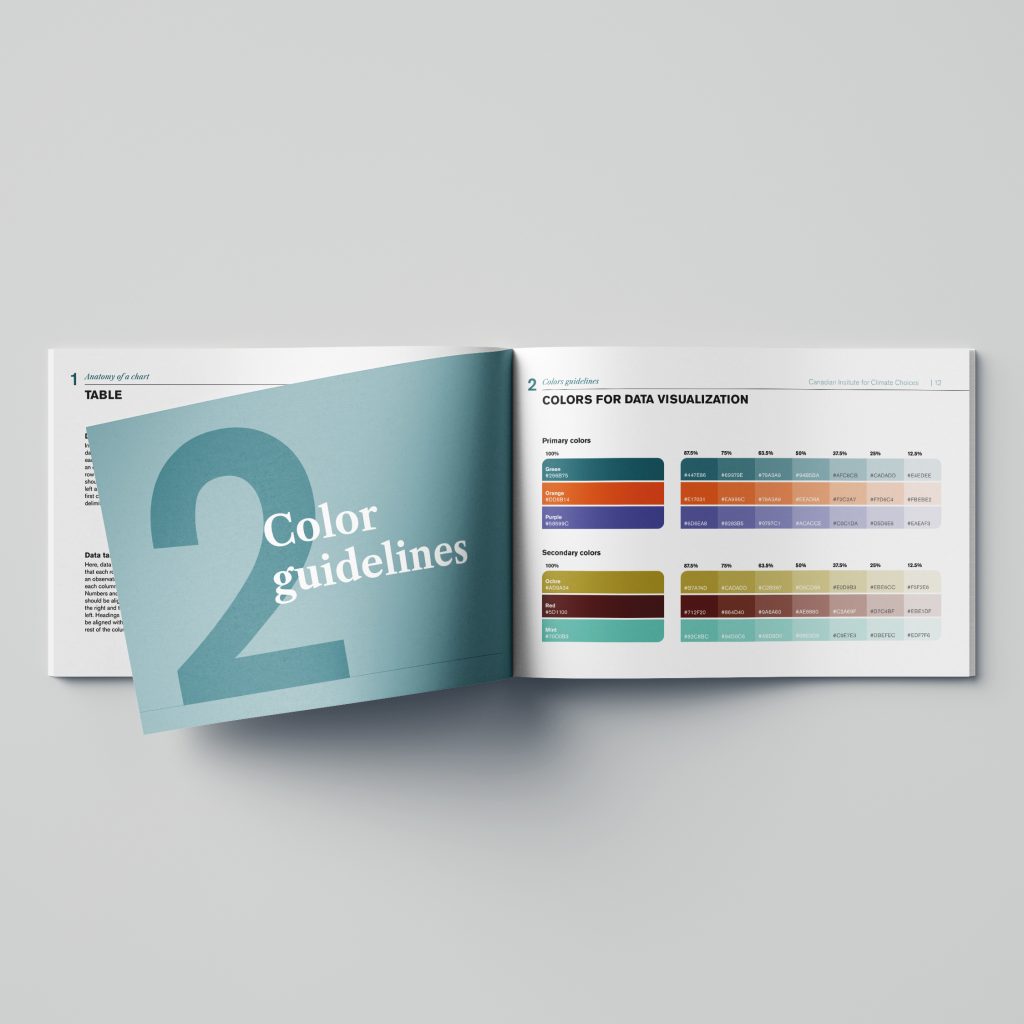
Setting standards for climate charts The Canadian Climate Institute approached Voilà: for a data visualization style guide with two broad objectives in mind. Firstly, ensuring that, externally, all communication materials are clear and effective. Secondly, raising awareness, internally, around data viz best practices and spreading this knowledge among internal stakeholders. As a result, we produced […]