Local biodiversity: the impact of investments finally measured
Major Quebec financial institutions are partnering with the Biodiversité Québec research team, the Canadian Parks and Wilderness Society (CPAWS Quebec), and the Quebec Centre for Biodiversity Science (QCBS) to create a tool unlike any other in Quebec. Designed for investors, it calculates the impact of their projects on local biodiversity and conservation. Available as a web application, it allows users to input project data and assess impacts based on nine revealing indicators.
Tool design
The clients already possess the scientific, financial, and technical expertise. They turned to Voilà: to make the information clear and accessible.
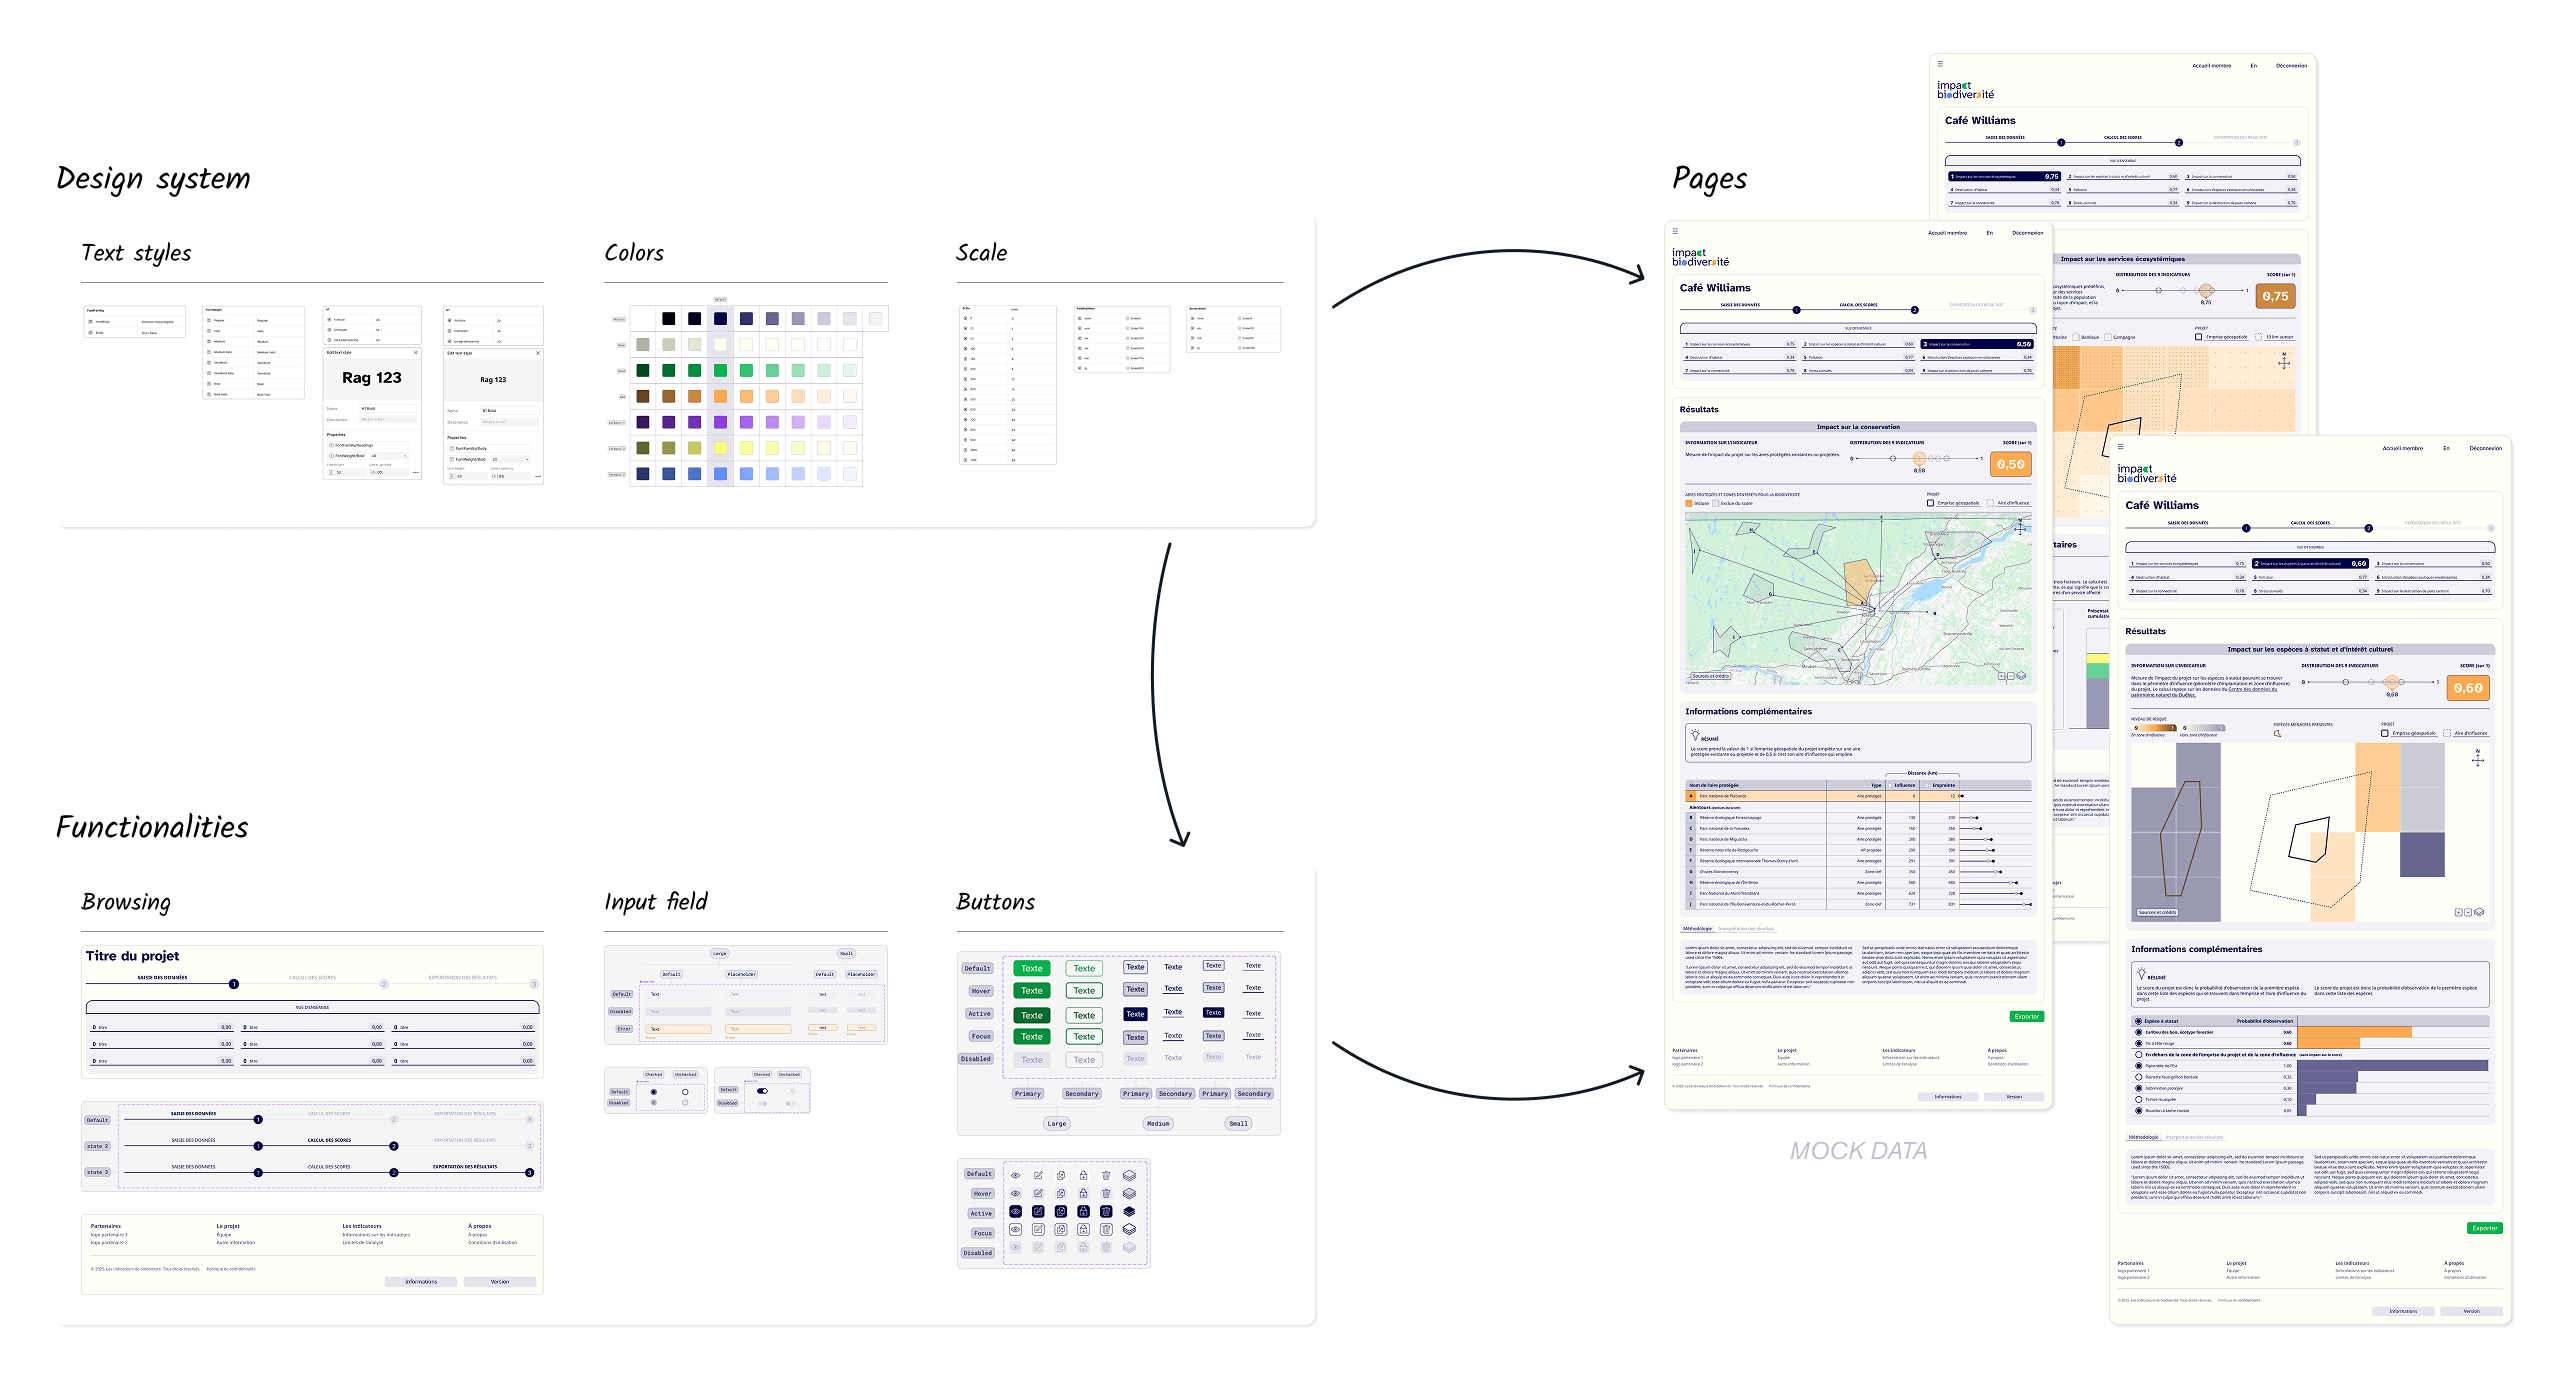
We created a functional mockup to structure the information and validate the user experience, and designed the product page by page—covering the charts, maps, design system, colours, typography, and features. Biodiversité Québec will handle the tool’s development and deployment.
Place for information design
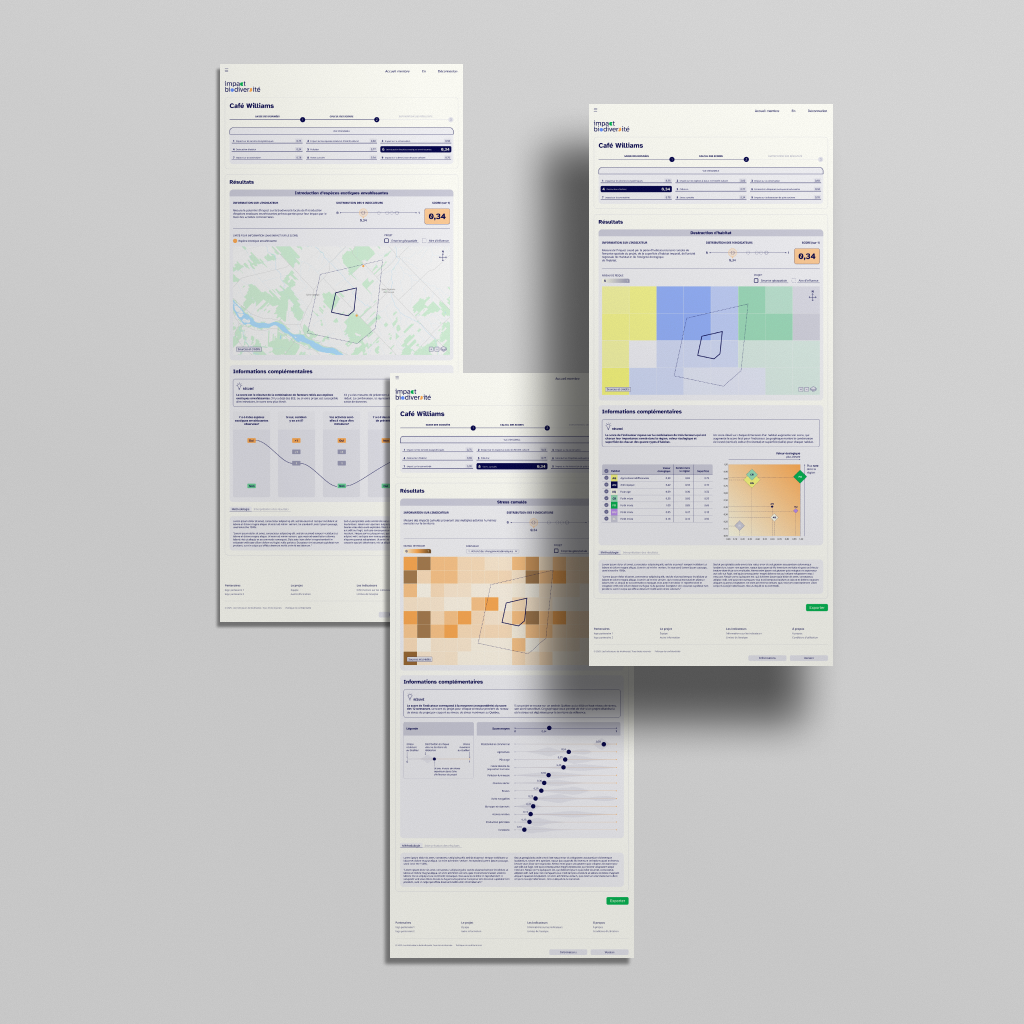
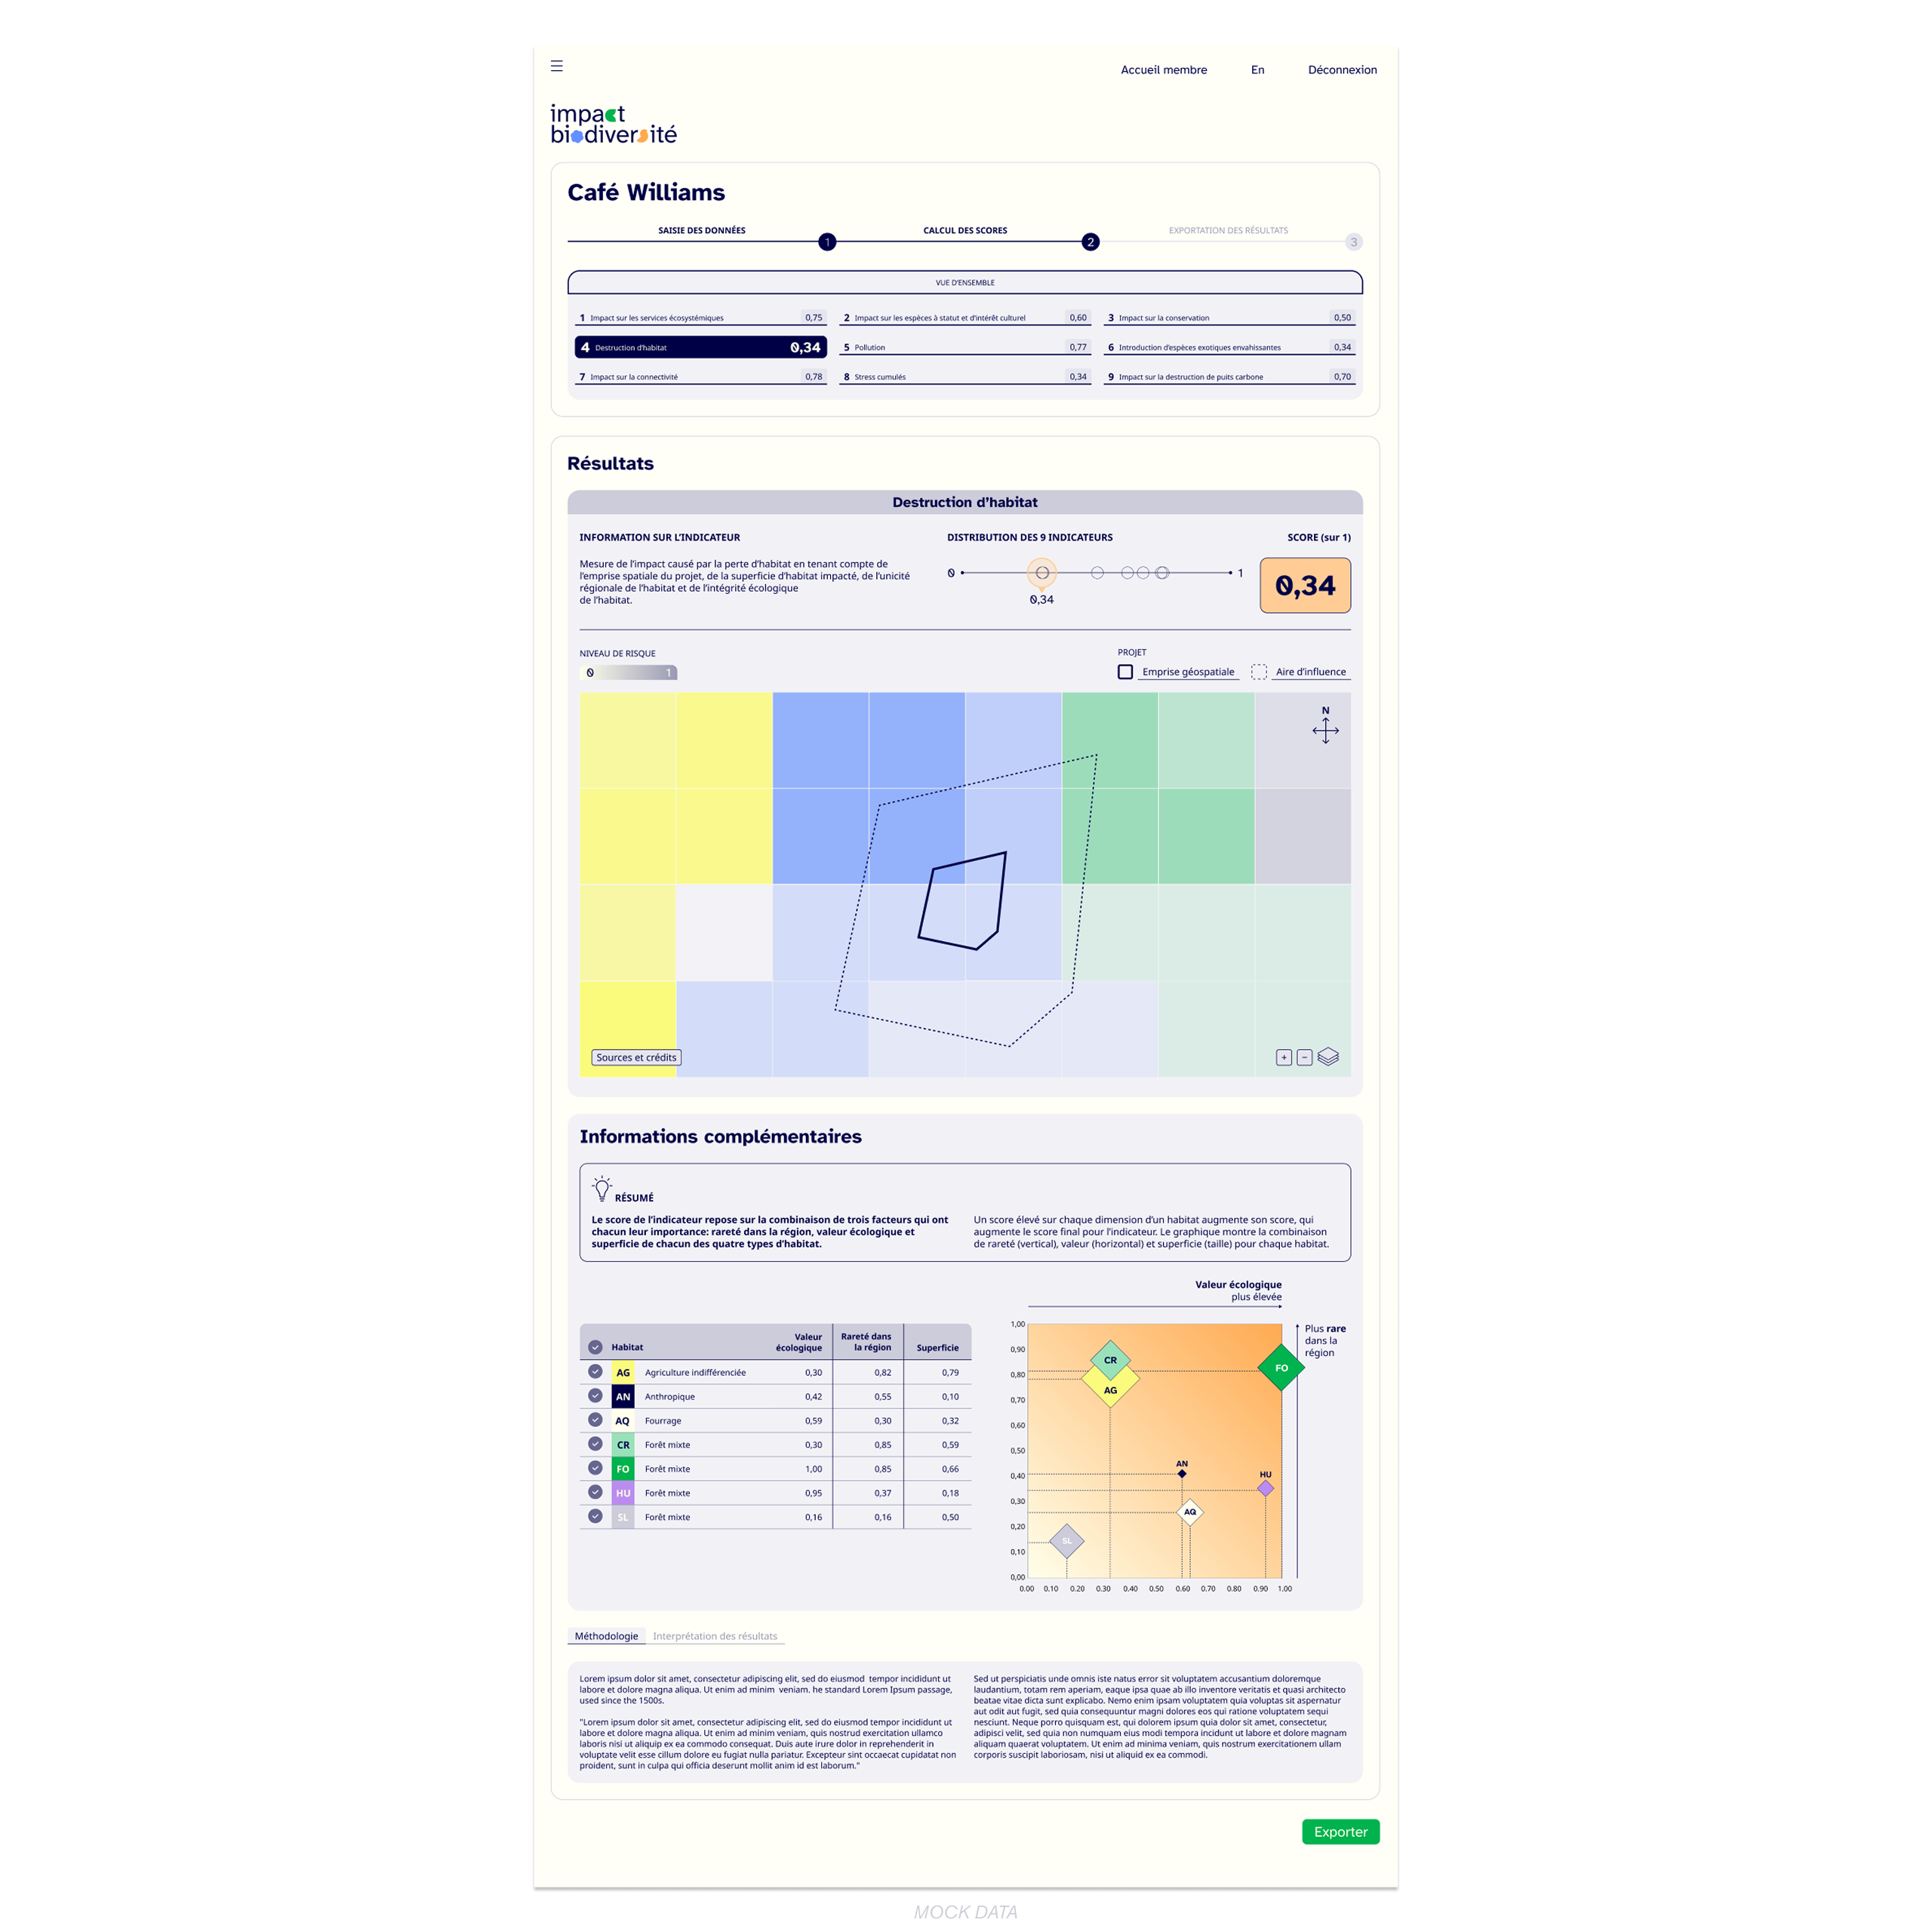
This tool contains nine indicators of biodiversity for investors. Our role was to explain the basis for each indicator’s score, thereby enabling informed decision-making. Each indicator combines a map and a graph that detail the project’s impact.
Here is a sample:
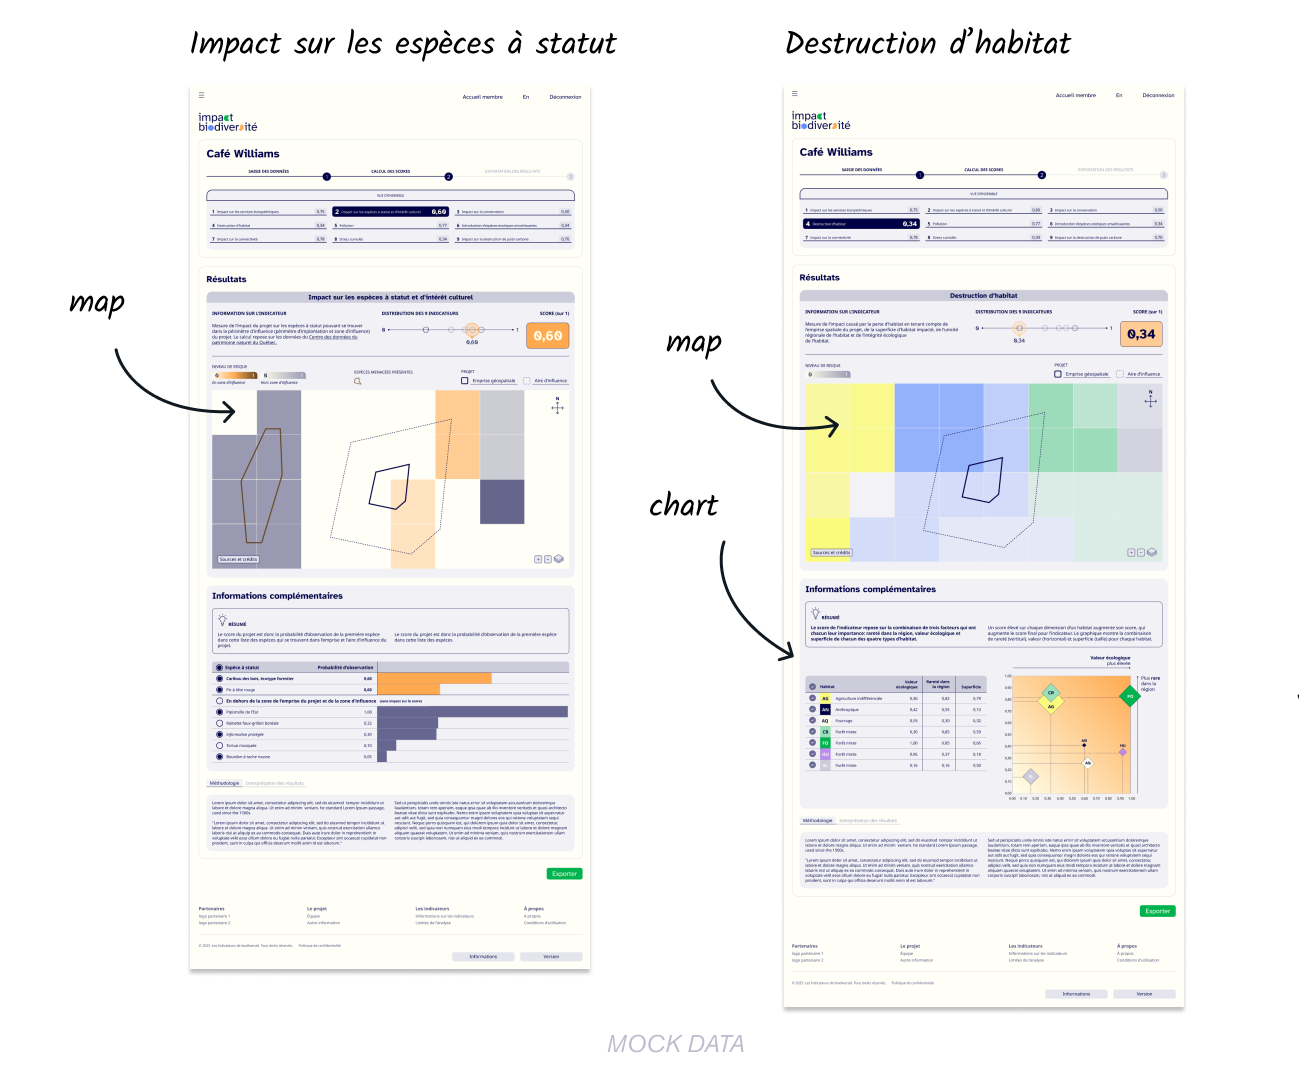
Impact on species of conservation concern (map) The map shows the project footprint and the presence of threatened species. It illustrates where the project encroaches on areas of varying risk levels, indicated by color shading.
Habitat destruction (map and graph) The map and graph use a shared color code for different habitat types. The map shows which habitat types the project encroaches upon, while the graph displays the ecological value of each habitat.
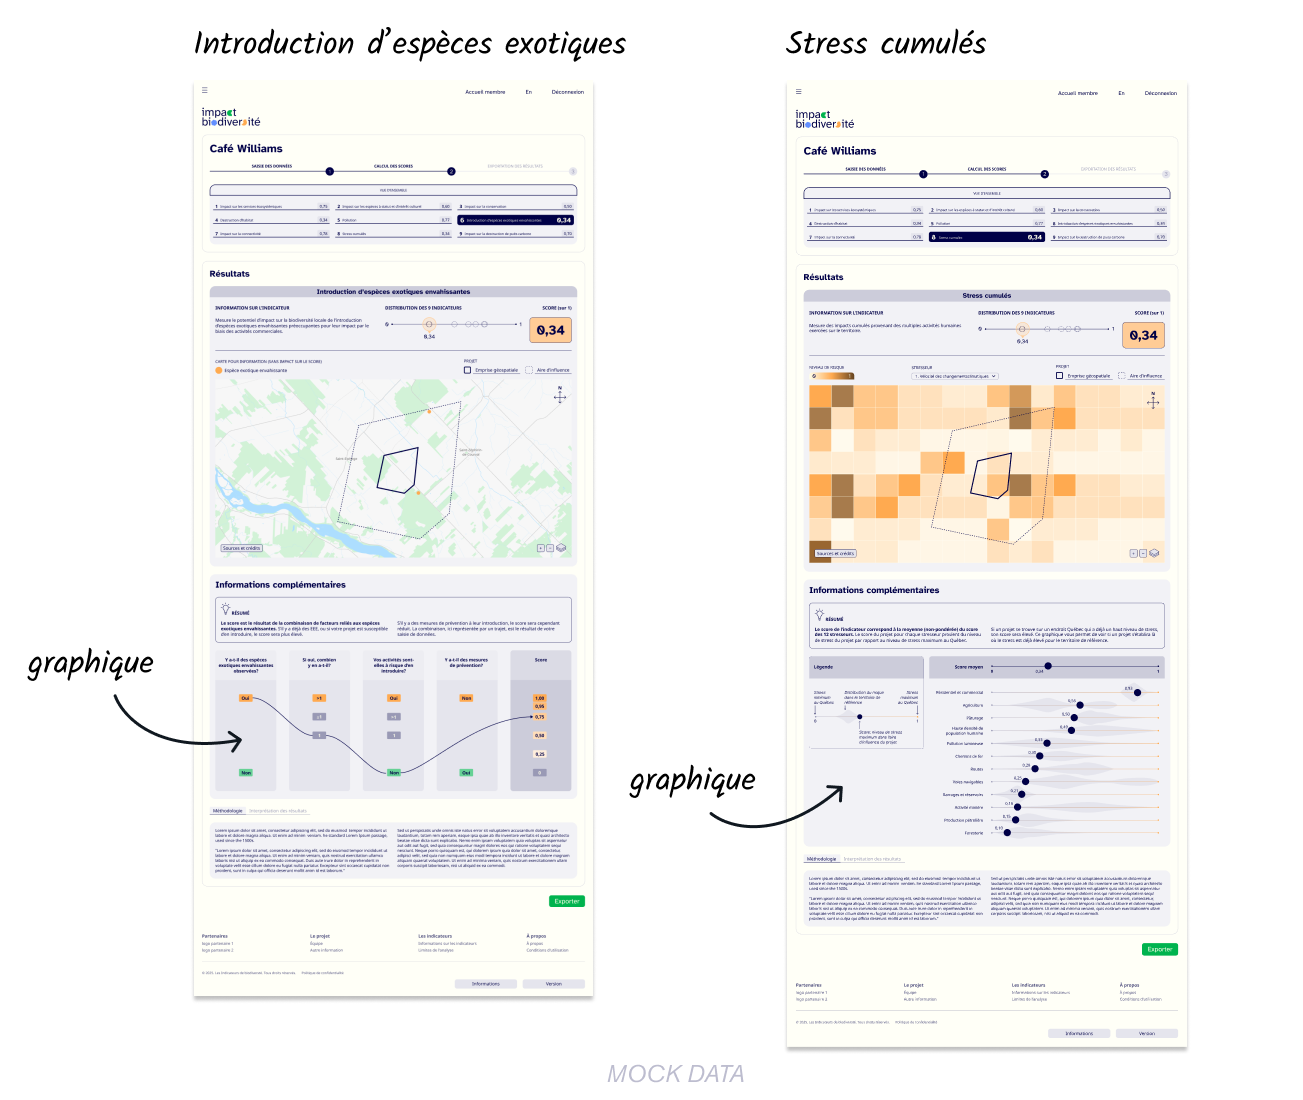
Introduction of exotic species (graph) The map overlays the project footprint with the locations of specific invasive exotic species, represented by dots. The graph illustrates how a combination of factors determines the project’s score for this indicator.
Cumulative stress (graph with legend) This graph plots the project’s stress level against the reference area for 12 different stressors. It shows both the project’s score and whether it is located in a particularly vulnerable area.
The final result: a web application accessible to everyone
The result is a secure web application where investors enter their project data and receive these detailed results in return. An overview provides access to all projects: active, in development, and archived.
Do you have data that you would like to communicate effectively? Contact us.