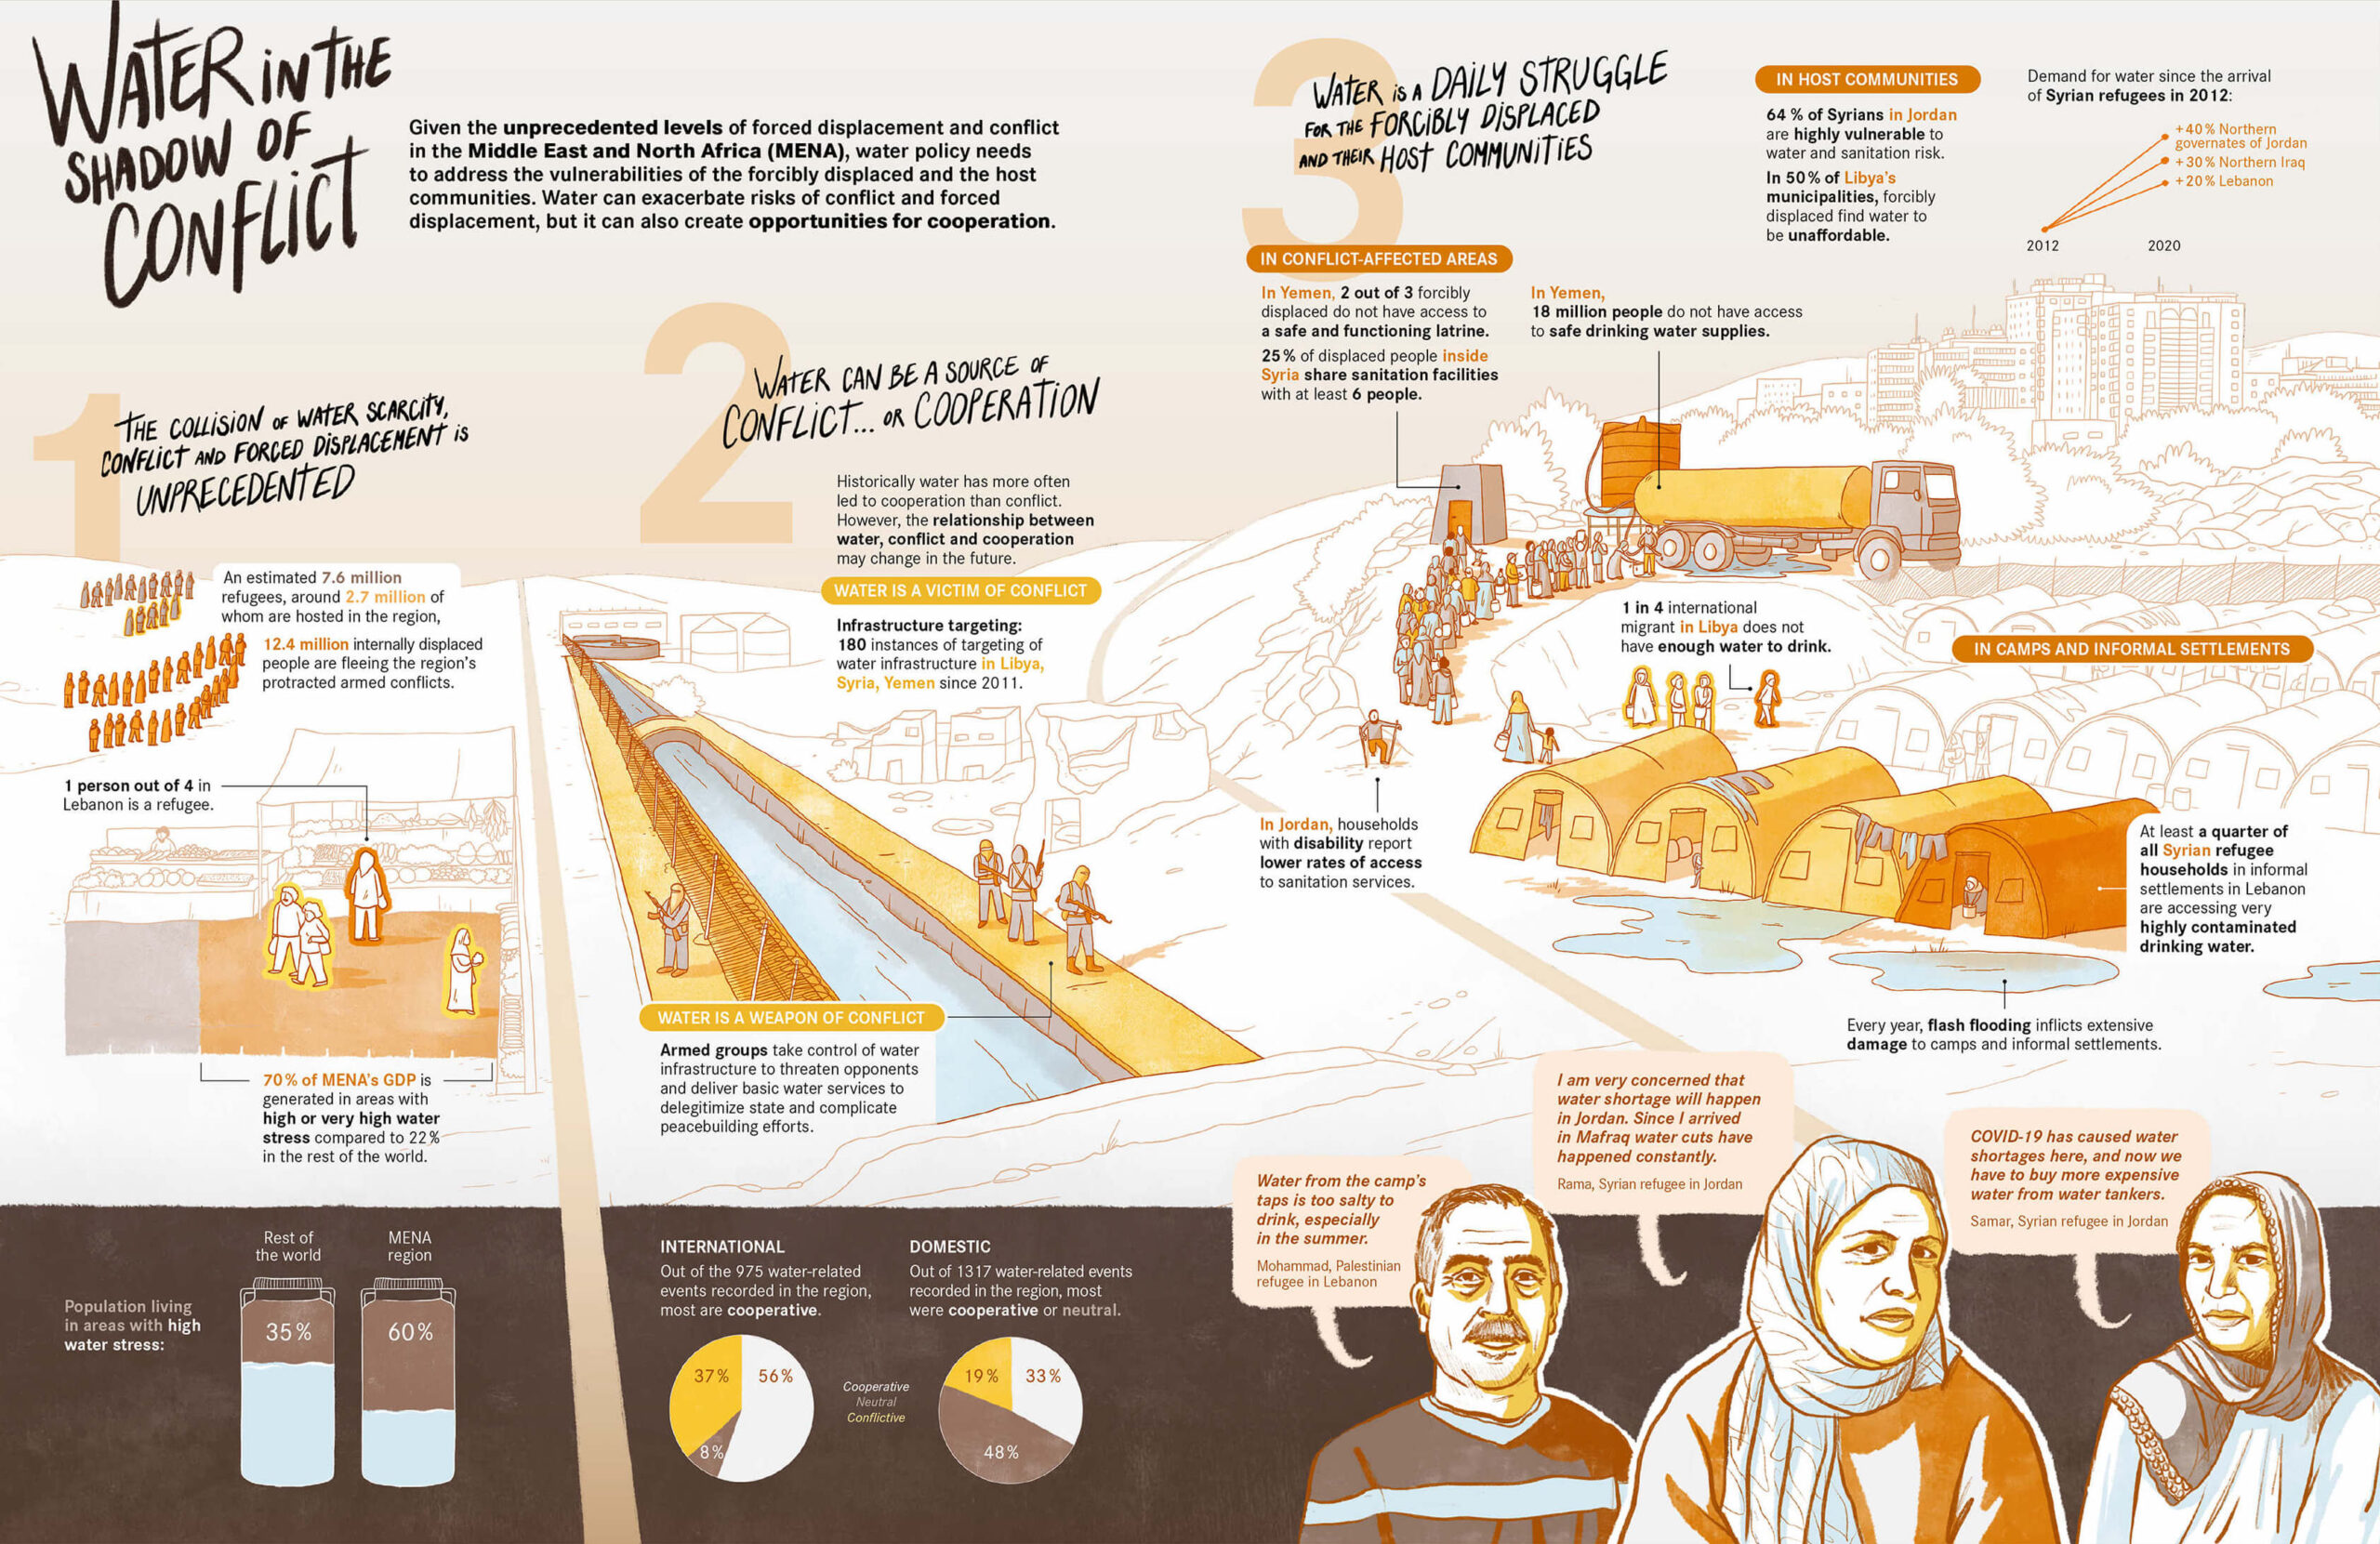
Le plus récent projet ajouté à notre portfolio montre comment une demande d’infographique de la part d’un client peut prendre une direction différente.
Cela a commencé comme la plupart des projets, avec un rapport truffé de faits et de chiffres sur un sujet important : le rôle de l’eau potable dans les conflits au Moyen-Orient et en Afrique du Nord.
Le client s’est présenté avec ses données et messages en main et il semblait en effet que quelques graphiques pourraient faire le travail.
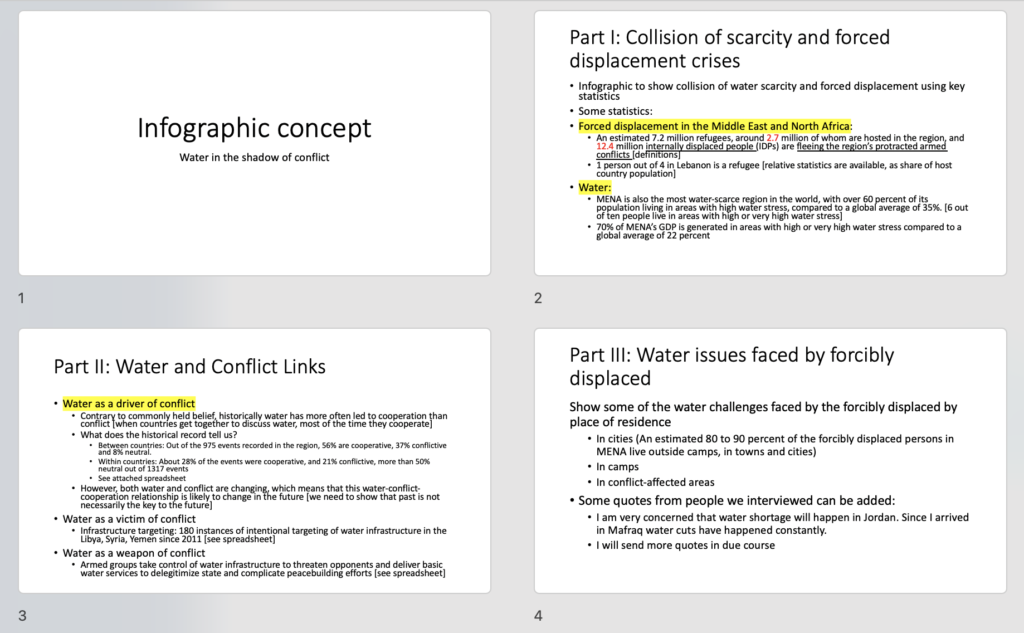
Mais à y regarder de plus près, ces données racontaient une tragédie humaine et il n’était pas clair que quelques graphiques informatiques puissent bien traduire la réalité de ces découvertes. Les données sont bien plus que des chiffres.
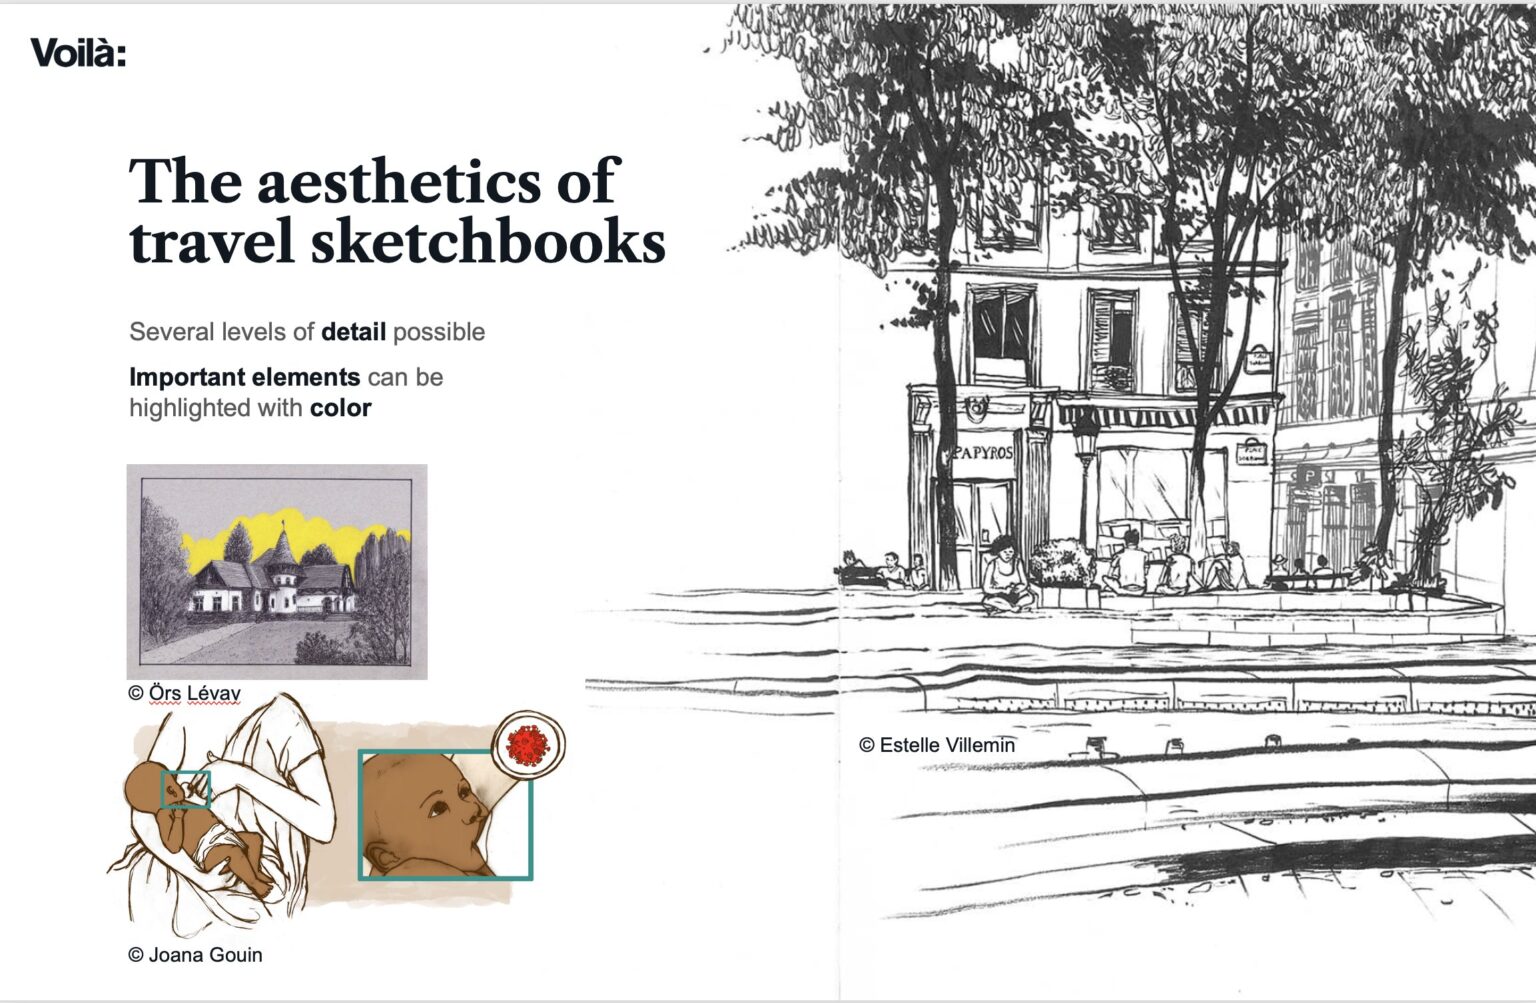
Estelle Villemin et moi avons plutôt pensé aborder ce sujet avec une illustration qui communiquerait mieux l’expérience humaine. Nous avons proposé de puiser dans l’atmosphère et le style des carnets de voyage (quelque chose qu’Estelle fait quand elle voyage et c’est merveilleux! voir exemple à droite, ci-dessous).
Mon moment préféré de la collaboration fut lorsque nous avons remarqué que le modèle que nous utilisions pour montrer la palette de couleurs ressemblait beaucoup au client!
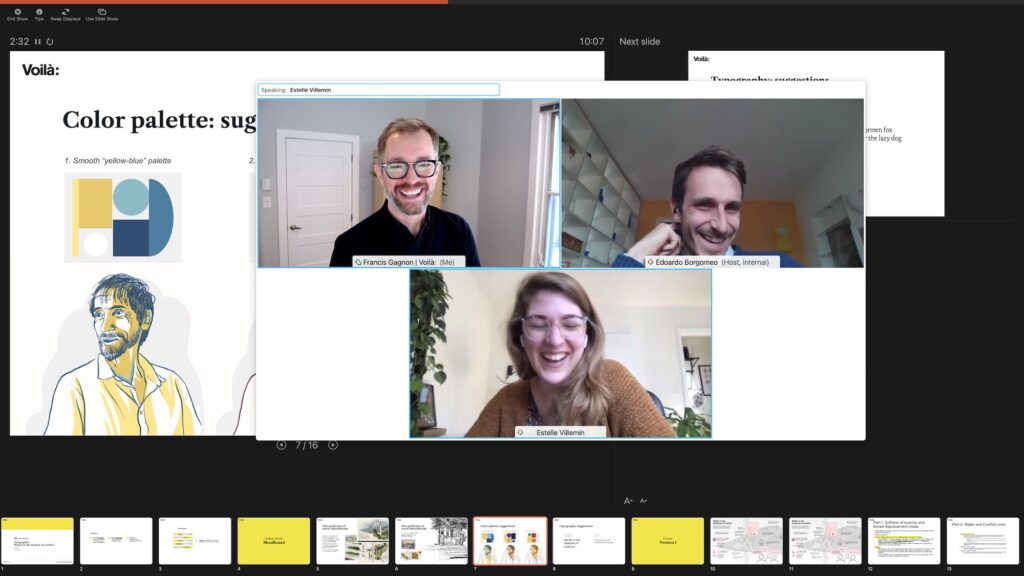
Nous avons même apporté à cette rencontre un croquis de l’illustration pour montrer comment les messages seraient répartis dans la page, et proposer déjà quelques idées pour approbation.
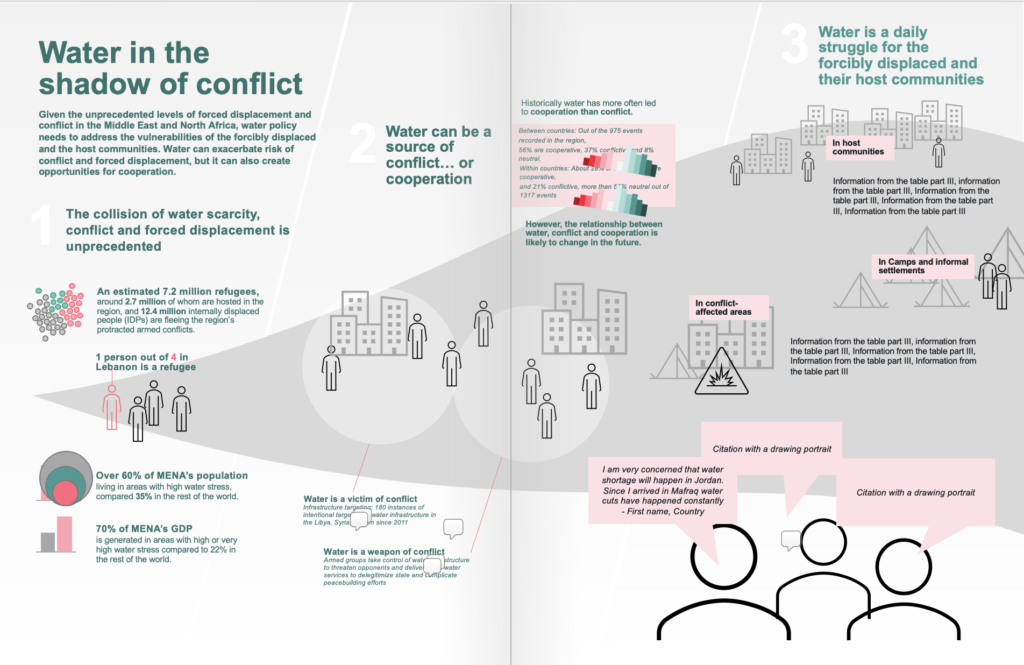
Avec la collaboration du client, nous avons fait des recherches sur la réalité des réfugiés au Moyen-Orient pour nous assurer que nos illustrations seraient exactes et respectueuses des gens qu’elles allaient représenter.
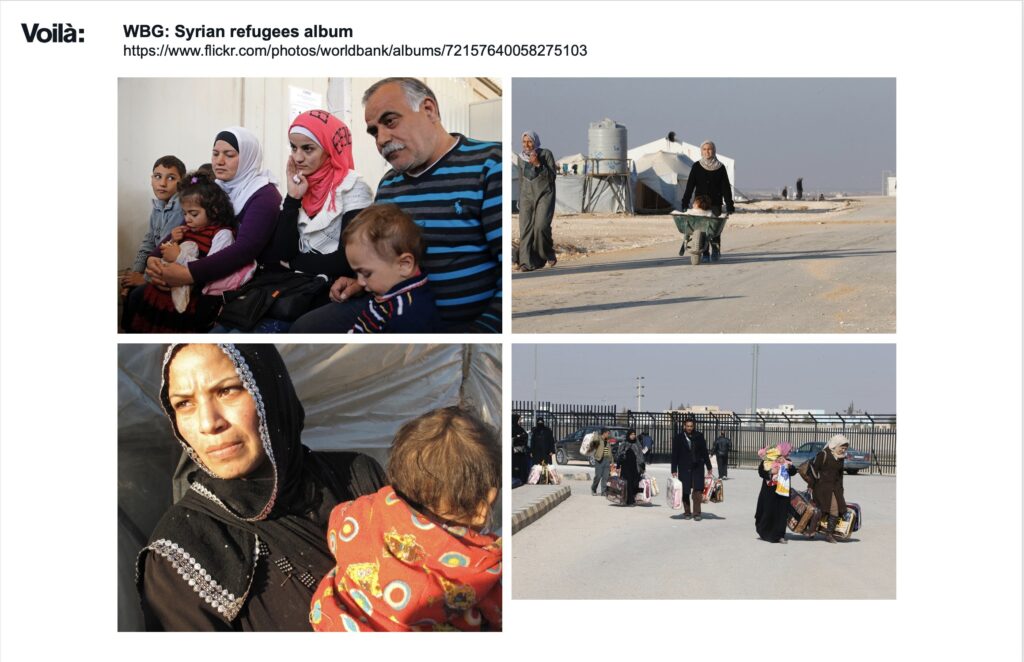
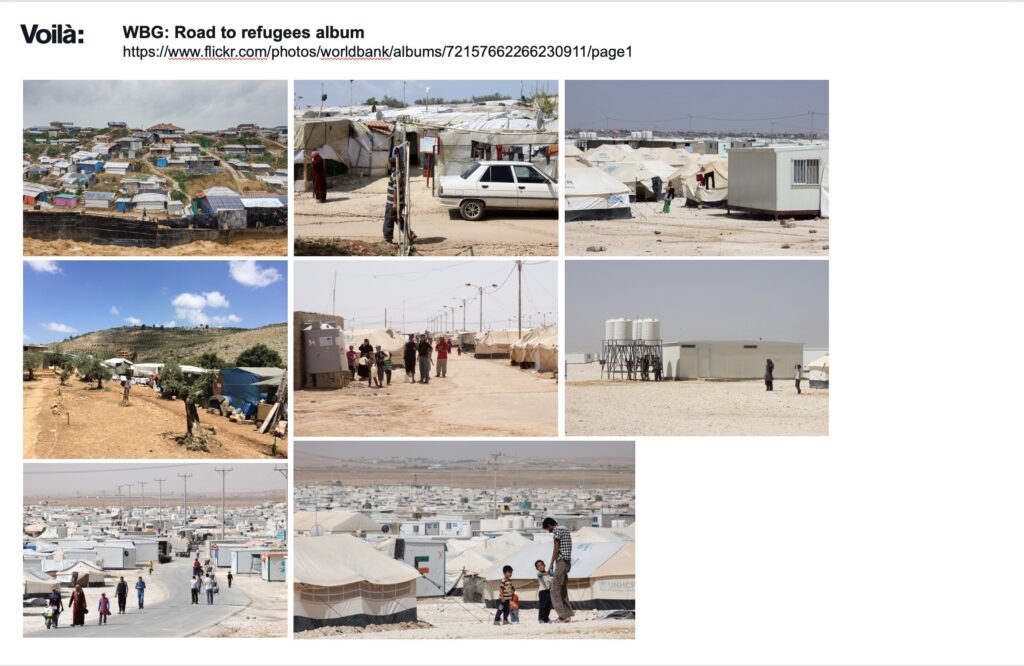
Nous nous sommes ensuite mis au travail en plaçant le texte, en réfléchissant aux visuels, à la composition, etc.
Pour les titres, nous n’avons pas pu trouver une police qui nous convienne, alors Estelle a fini par les écrire elle-même à la main.
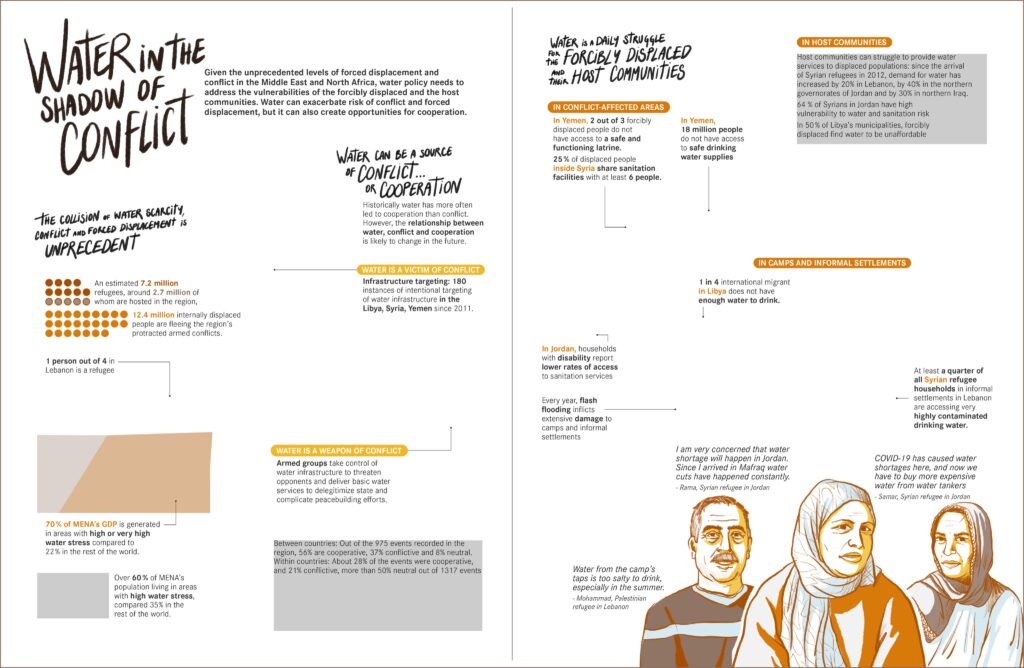
Ci-dessous est la première version que nous avons partagée avec le client. Estelle m’a surpris en créant un panorama unifié alors que j’avais imaginé une collection de petites scènes disposées dans la page. Son idée était bien meilleure.
La composition était là, les éléments principaux aussi, mais il restait à équilibrer le design pour obtenir plus de clarté.
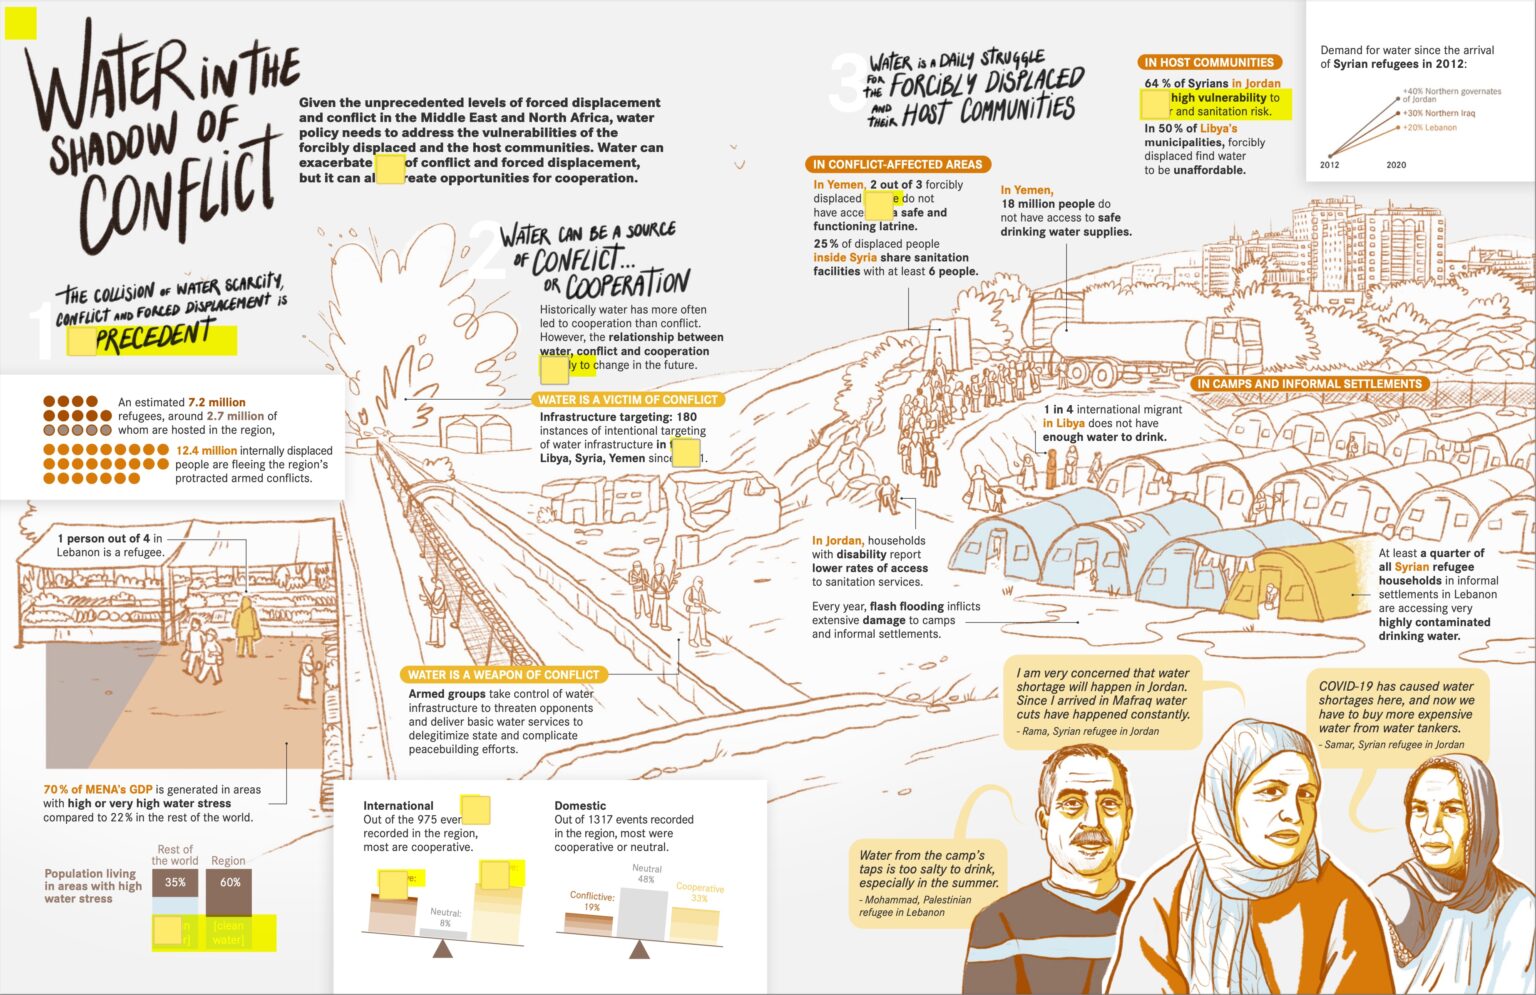
Voici un time-lapse d’une partie du développement de l’illustration…
… et voici la version finale.
Le changement le plus notable est l’ajout de la bande brune en bas pour mettre en évidence certains points de données et les témoignages. Le paysage, quant à lui, a été pâli pour mettre davantage l’accent sur les données illustrées.
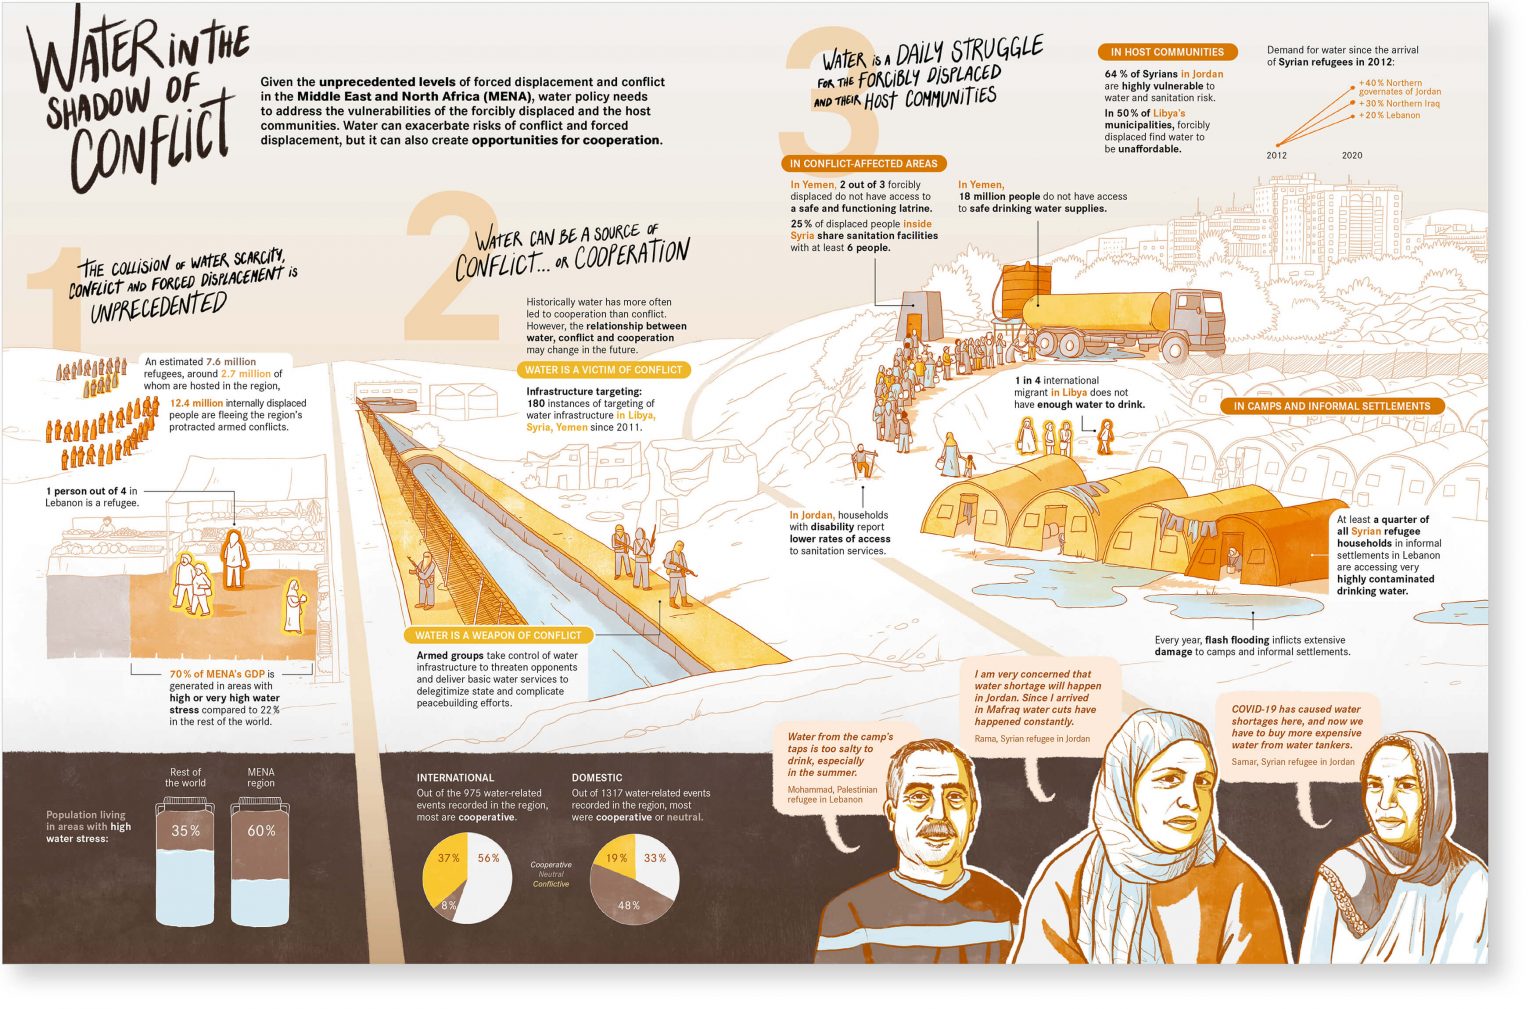
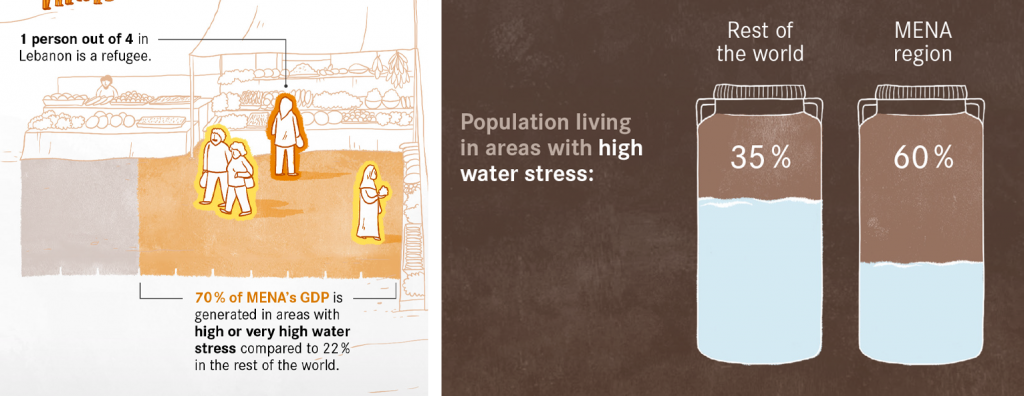
Nous avons utilisé un mélange d’illustrations de données, comme les silhouettes qui représentent « 1 sur 4 », mais aussi des graphiques intégrés, comme ces réservoirs d’eau rapportant des statistiques sur le stress hydrique.
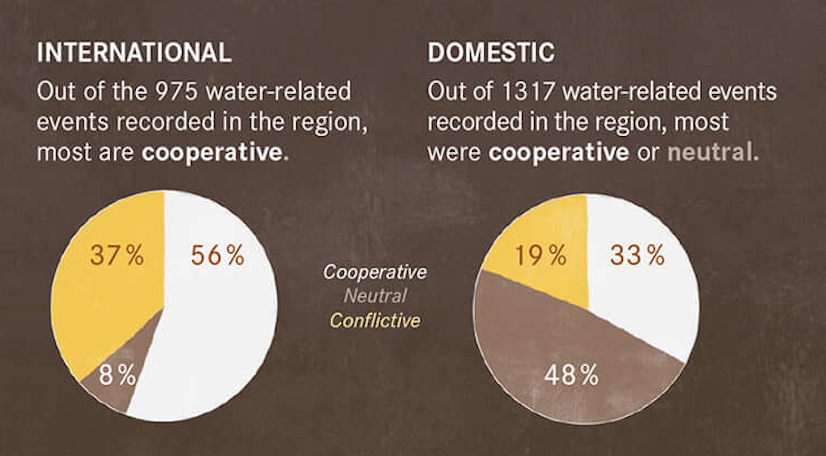
Parfois, nous avons simplement utilisé des graphiques normaux, car nous ne voulions pas non plus que le concept devienne trop fantaisiste.
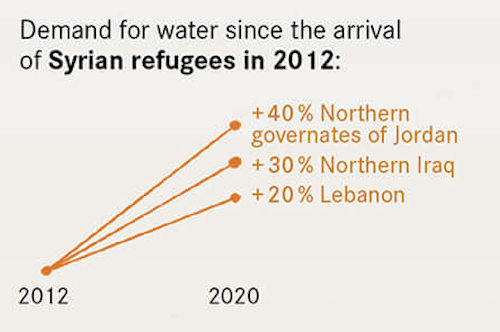
Vous pouvez maintenant voir le projet dans toute sa splendeur dans notre portfolio.
Ce projet traite d’un sujet qui touche la vie de millions de personnes vulnérables. Nous espérons donc que ce travail important de la Banque mondiale aura un large impact.
Francis Gagnon est designer d'information et le fondateur de Voilà: (2013), une agence de visualisation de données spécialisée dans le développement durable.

